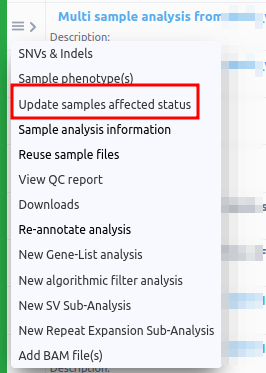
You can choose among a series of actions that allow you to retrieve information or generate different reports, providing an overview of your results, or further explore the analysis. You can also access this menu from the "Analysis Actions" button of the upper right corner at the variant table page.
- SNVs & Indels: The results of the analysis. When clicked from the Dashboard, it takes you to the variant table.
- Sample phenotype(s): Using these fields it is possible to add and modify the clinical description of the sample. You can choose this option if you want to provide phenotypes associated with your case from a drop-down menu or view the already selected ones. The phenotypes will be matched to the resulting variants. For more information please check the document "Phenotype Matching".
- Update sample affected status: It is possible to change the affected status of the merged analysis from the three horizontal lines next to the analysis name on the Analyses page. This option is useful in order to run algorithmic filters for segregating variants, where you need to set which sample is the affected and unaffected respectively.
You will be directed to a screen, as the one shown below:
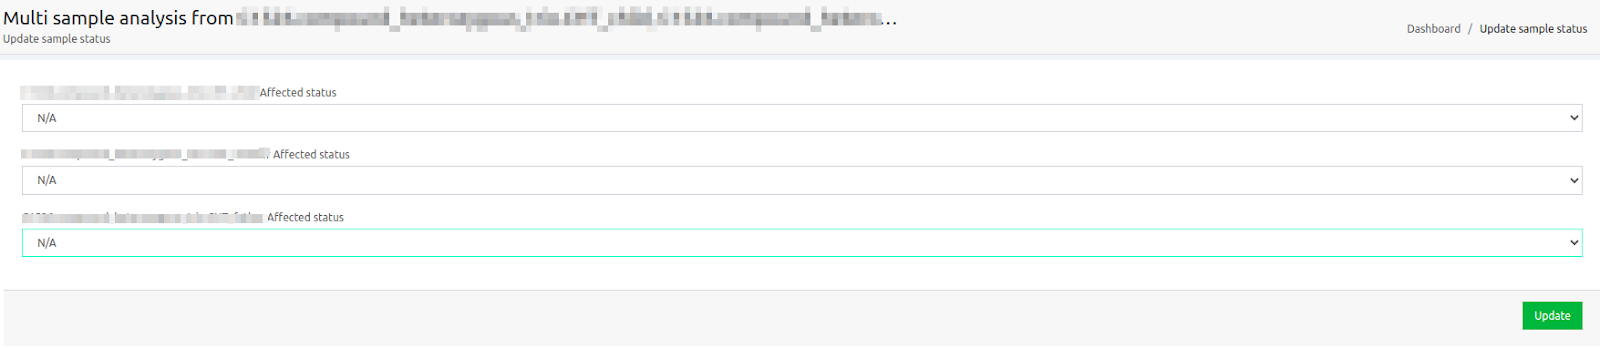
You can delete the filters displayed, then update the affected/unaffected status of your samples and run the algorithmic filters you would like for your merged analysis.
- Sample analysis information: It opens a pop-up table with an overview of information about the analysis and the sample, the sequencing (e.g. capture method, number of reads and bases, sequencer), the analysis (e.g. the versions of the databases and the implemented pipelines and software), databases, classification (e.g. ACMG annotator version) and other useful metrics such as those mentioned below.
- Predicted Sex: As part of the main analysis, the sample sex is predicted based on zygosity in selected chromosome X SNVs. The algorithm assumes that females are XX and males are XY. Sex is predicted with a p-value (binomial test) <0.01, otherwise sex is undetermined. INDELs are not considered in the calculation due to their higher false positive rate.
- Rare Homozygous Count: This metric provides the fraction of rare variants in homozygosity. - A minimum of 50 genotypes are required to report results.
- A SNV is considered rare when its frequency is below 1% or if it is unknown.
- InDels are not considered in the calculation due to their higher false positive rate.
- The number of rare SNVs and their fraction in homozygosity is reported. - Runs of Homozygosity: Samples are scanned for the presence of extended segments of homozygosity. Runs of homozygosity (ROH) are computed directly from the VCF file. These calculations are based on the information contained in the VCF file (either the user's or the one generated by VarSome Clinical) and specifically on the either genotype likelihoods (PL) or genotypes (GT). By default, genotype likelihoods are expected. ROH is calculated for different minimum region sizes (100Kb, 500Kb, 1.5Mb and 5Mb). For each size, we calculate the number of regions of that size or greater which show evidence of ROH.
- ROH are computed for germline samples, but not for somatic
- Only bi-allelic sites are considered in ROH calculations.
- ROH are only reported for autosomal chromosomes.
- All ROH have a minimum of 50 variants
- INDELs are not considered in the calculation due to their higher false positive rate.
- Minimum ROH quality (Phred score) is 20. ROH quality represents the probability of the state assignment being incorrect. Larger values indicate a more confident call.
- ROH is calculated for all analyses. Please note, however, that ROH results for small, targeted panels are less reliable because of the sparseness of the target regions.
The following ROH related metrics are reported for each length threshold in "Analysis Actions" > "Sample analysis information":
- NROH: The number of ROH sections detected in the sample
- SROH: The total length of ROH in bp
- maxROH: The length of longest ROH segment in bp
- FROH: The fraction of autosomal genome in autozygosity
- Reuse sample files: This option is available if you wish to reuse an existing sample for a new analysis. A blue box message in the upper right corner of the page will let you know that you will receive an email when the input file(s) of the sample is/are again available for new analysis and which you can view in the "Upload / view files" page.
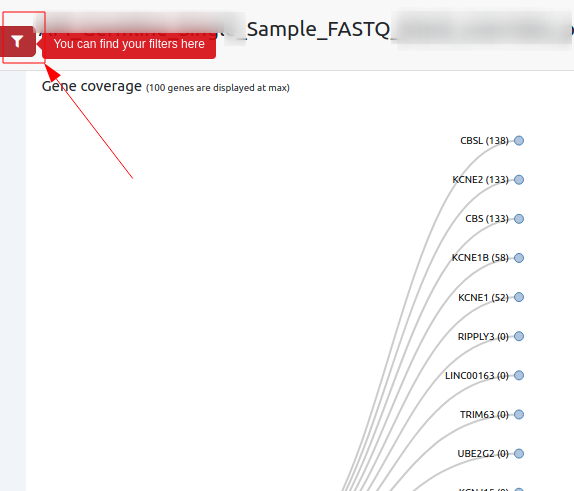
- Gene coverage: When clicking on Gene Coverage, a new window will open showing a tree with the coverage per gene.
Please note that only information for 100 or fewer genes is shown since the depiction of more genes would be impractical. If you wish to see coverage information for analyses with more than 100 genes, please use a gene list to limit the displayed results to 100 genes or fewer.

Clicking on any gene will result in a tree of its transcripts and each transcript is also expanded to a tree showing the coverage of individual exons. Clicking on an exon will open a new tab, showing the read coverage from the corresponding BAM file.
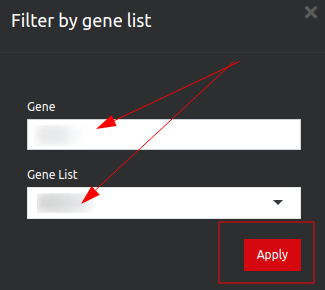
If you click on the filter icon on the top left corner this will take you to a new page, showing a long list of genes. You can filter for your gene of interest:
The following options concern the generation of different reports and can be useful when the user needs to check the quality of the sequencing in terms of coverage or retrieve information about the alignment. Please, refer to the article Report files to download for more information.
- View Quality Control report: You can view a quality control report about your analysis and download it as a PDF file or export it as a docx file. The report includes a list of information such as sequence technology, read alignment results, regions reported, coverage, number of identified variants by class, summary for ACMG rules and number of SNV found in coding regions. For more information, please refer to the article Quality Control Report.
- View FastQC report: A quality control report for high throughput sequence data. For more information please see the documentation of the FastQC tool at http://www.bioinformatics.babraham.ac.uk/projects/fastqc/ and in the article FastQC Report.
- Coding coverage report: You can use a previously created gene list to produce an Excel document file reporting coverage information of the coding regions included in the analyzed gene list. This report can be exported for all component samples of a multi-sample analysis.
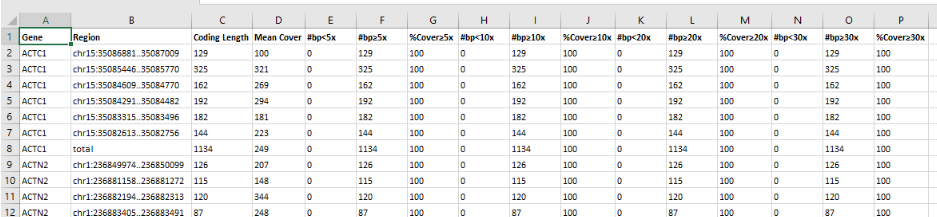
- Region list coverage report: You can use a list of regions of interest to produce an Excel document reporting coverage information. Contact us in case you want to add regions to your analysis.
- Downloads: This option directs you to a new screen where you can see any files associated with this analysis that are ready to be downloaded.
Sample Data File:
- VCF file: A compressed (*.vcf.gz) vcf file will be downloaded with the results of the variant calling.
- For sub-analysis (gene list analysis and algorithmic filters) there is a new option to “Generate VCF” that contains only the filtered variants.
- BAM file: Download the bam file (the sample's reads aligned against the reference genome) used in the analysis. For multi sample analyzes you will find the BAM (and BAI) files for each component sample.
- BAI file: The BAI file format is the index file of a BAM file. This is a companion file for your previous BAM file, which doesn't contain any sequence data but acts as an external table of contents allowing a computational tool to navigate in the BAM file and locate specific parts.
- Fusion input File (available only in DNA + RNA and RNA fusion analyses)
- QC report (PDF)
- QC report (docx)
- VCF file: A compressed (*.vcf.gz) vcf file will be downloaded with the results of the variant calling.
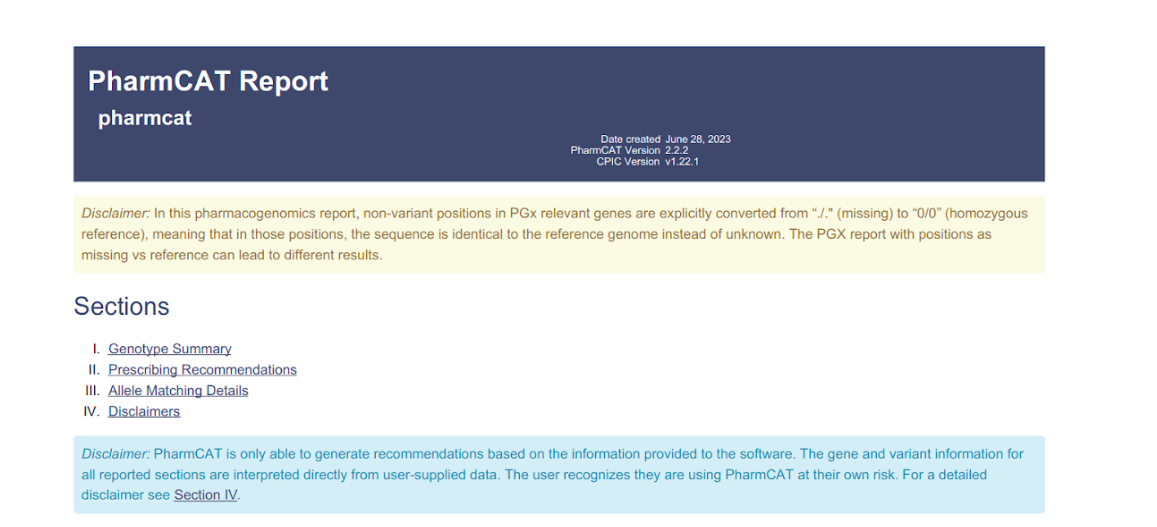
- Download PGX report: PharmCAT is a pharmacogenomics clinical annotation tool that generates a report containing genotype-based prescribing recommendation. This option is available for WGS samples, run against hg38 and using one of the WGS capture methods: ‘WGS+PCR' or ‘WGS-PCR'.
The report comprises 4 sections:- Genotype Summary: This section has a summarized table of the matched genotypes and the following associated clinical annotations: Drug, Gene, Allele Functionality and Phenotype
- Prescribing Recommendations: This section includes a list of recommendations per associated drug, along with bibliographical reference material
- Allele Matching Details: Detailed information about how data in the sample VCF matches up with haplotype definitions
- Disclaimers: PharmCAT disclaimer (in blue) as stated in their website and the disclaimer about the default running parameters in Varsome Clinical (in yellow), as shown below.
Typically in WGS samples, a large fraction of the PGx relevant positions that are considered by pharmCAT are absent from the input VCF. If those missing positions are assumed to be “no-call”, the resulting PGx report results in the output of multiple possible genotypes, and hence less specific treatment recommendations.
In VarSome Clinical, we assume that all missing PGx relevant positions are homozygous references. However, this may not reflect reality, because such positions may, in fact, be unreadable or uncallable. Running PharmCAT with positions as missing vs reference can lead to different results.
- Coverage report for targeted regions: Generates a coverage report for the regions captured by the specific assay that you selected when launching the analysis.
- Re-annotate analysis: Reannotating will not change the list of identified variants (we do not perform the calling again), it will simply re-annotate the same list of variants using the data available on the day of re-annotation. This means that some Germline Variant Classifications might change if they are affected by newer data. Re-annotating an analysis is charged at 50% of the price of the original analysis. The storage setting will use the re-annotation date as the new creation date.
- New Gene-List Analysis: This option will restart the analysis with the same sample using a previously generated gene list of selected genes or a gene list created from selected phenotype(s) or disease(s). It will appear as a sub-analysis of the initial analysis.
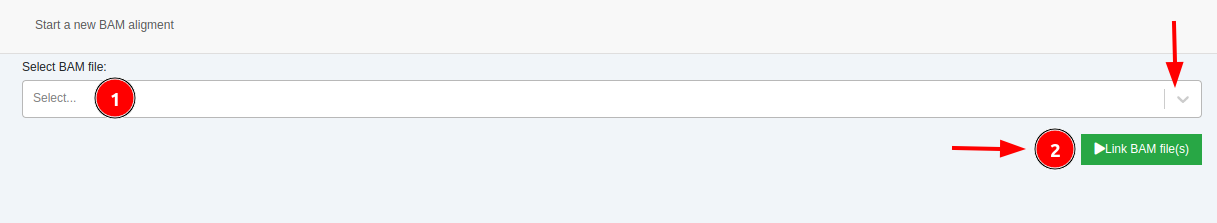
- Add BAM file(s): Select a BAM file for alignment visualization. If your sample type is VCF, you can upload and add a BAM file to visualize the alignment.
Once the BAM file is added to a sample, IGV and JBrowse links will be displayed on the “Coverage” column of the Variant Table. These links will allow you to visualize the alignments in each variant position.
Please note that the BAM file will be taken into account when calculating storage fees. For more details please read the Storage Management section.
- New Algorithmic Filter Analysis: Opens a new screen with the available algorithmic filters. Please click on the info
icon, to get a description of each filter. Algorithmic filters create a snapshot of the parent analysis, with a filtered subset of variants, according to each Algorithmic filter. You can run a sub-analysis by choosing a filter from the list or you can ask for a custom-made filter. Please see Algorithmic FIlter.
- NEW SV Sub-analysis: Launching an SV analysis from VCF as seen in SV annotation (from VCF).
- NEW Repeat Expansion Sub-analysis: Launching a CNV analysis VCF as seen in Repeat expansion annotation from VCF file.
- Archive sample data: The analysis will be archived and a VCF file will be stored.
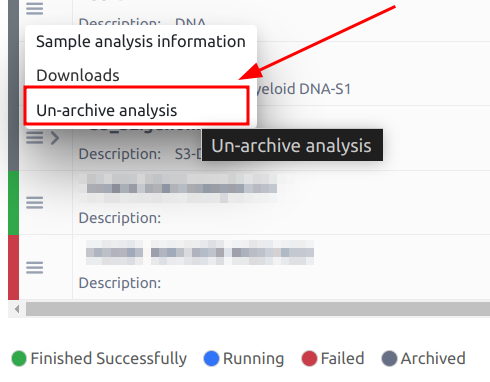
- Un-archive analysis: When an analysis is archived, you can choose to un-archive it by selecting the “Un-archive analysis” and your data will be re-annotated.

- Delete FASTQ sample data: Allows the user to delete the FASTQ files used for the analysis. Once this option has been used, this will be disabled meaning that the files have been deleted from the server.
- Delete BAM sample data: Allows the user to delete the bam file produced by the alignment during the analysis. Once this option has been used, this will be disabled, meaning that the files have been deleted from the server.
- RNA Fusions (available only in DNA+RNA and RNA fusion analyses): It opens a new screen with the RNA fusion results
- Delete (available only for sub-analyses): Allow users to delete the sub-analyses they launched under a main analysis.

Please note that we cannot stop an analysis in progress. If you need to stop an analysis, you will have to wait for it to either complete successfully or fail. After that, you can ask our support team to delete it.