A quality control report for high throughput sequence data. For more information please see the documentation of the FASTQC tool.
In order to find the FastQC report of an analysis in VarSome Clinical you can go either:
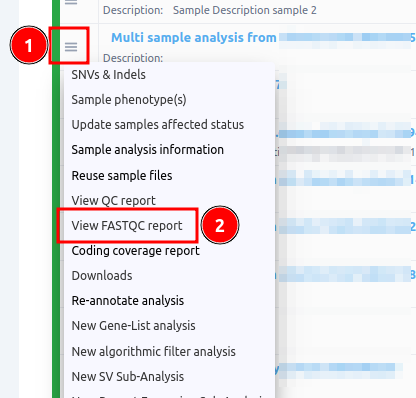
- to the Analyses page and select from the burger menu of the analysis you wish the "View FastQC Report" as shown below, or
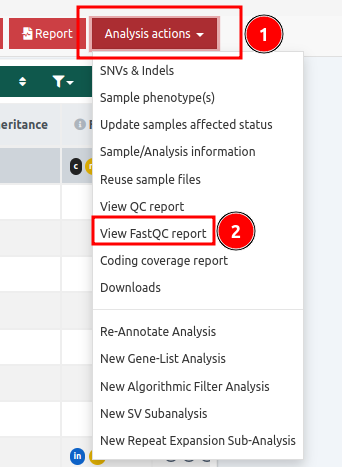
- in the Variant Table page you can click on the "Analysis actions" button and select the same option.
The different analyses (modules) performed for the FastQC report are summarized on the left of the screen, for each FASTQ file used for the analysis.
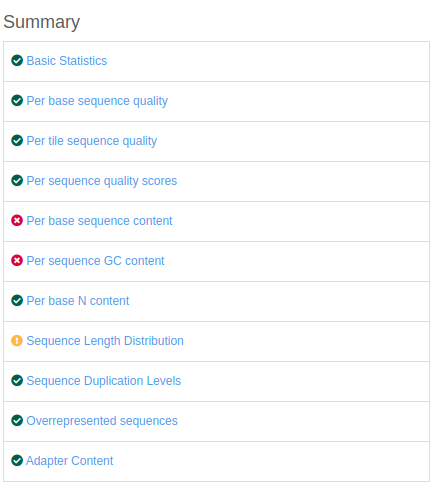
The symbol on the left of each module corresponds to a flag of "Passed", "Warn" or "Fail".
Here, we include examples for each module with what should be expected as a result:
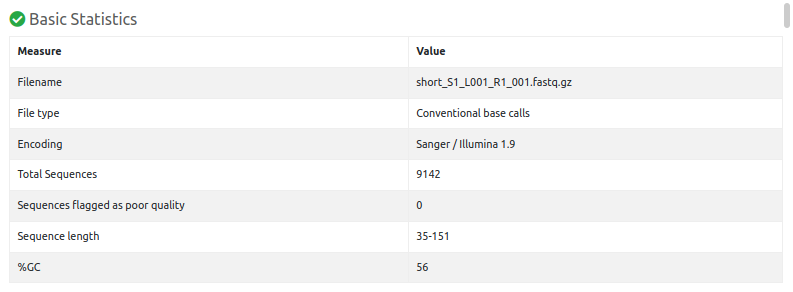
Basic Statistics
Simple information about input FASTQ file: its name, type of quality score encoding, total number of reads, read length and GC content.
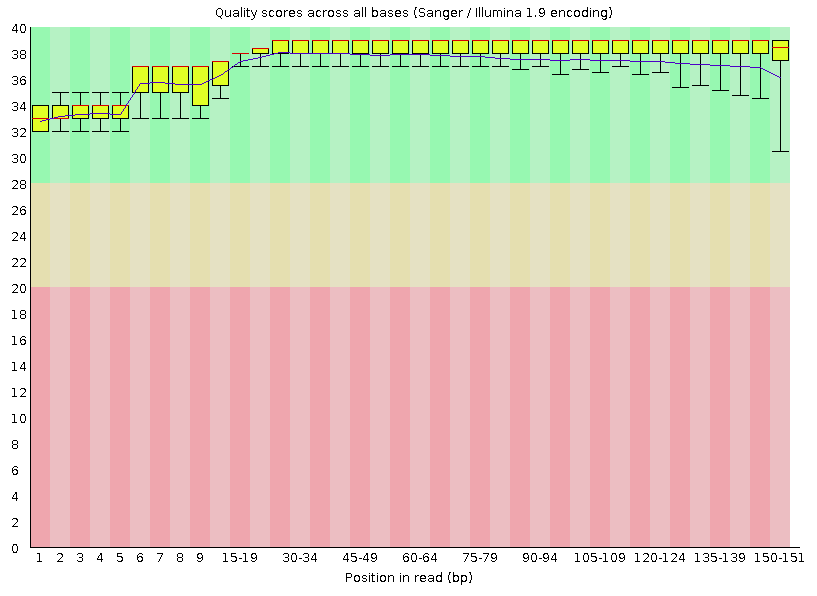
Per base sequence quality
A box plot showing aggregated quality score (Phred score) statistics at each position along all reads in the file.
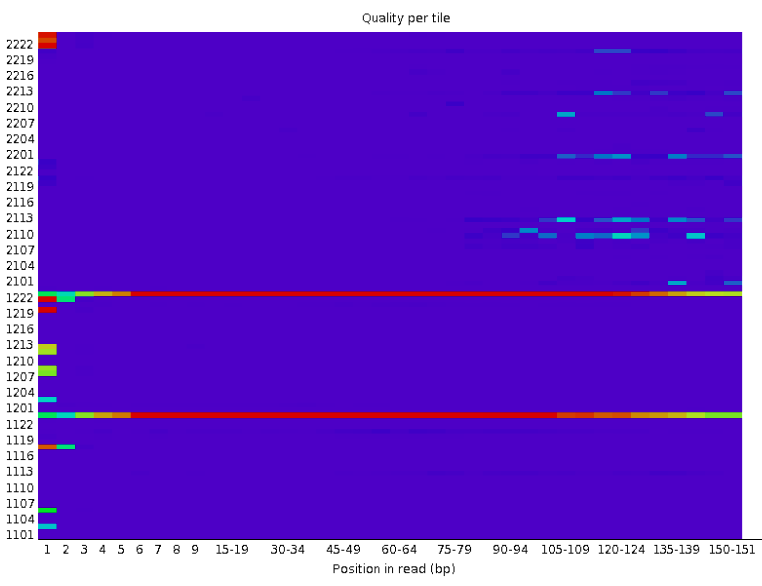
Per tile sequence quality
The graph allows you to look at the average quality scores from each tile across all of your bases to see if there was a loss in quality associated with only one part of the flow cell.
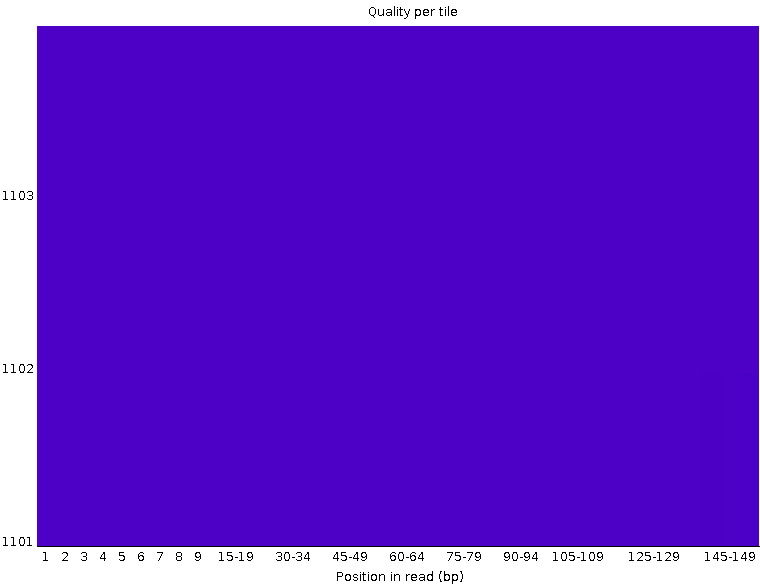
The picture above shows an ideal case, where no quality loss is reported in any tile of the flow cell. On the contrary, in the picture below you can see that certain tiles show consistently poor quality. The colours are on a cold to hot scale, with cold colours being positions where the quality was at or above the average for that base in the run, and hotter colours indicate that a tile had worse qualities than other tiles for that base.
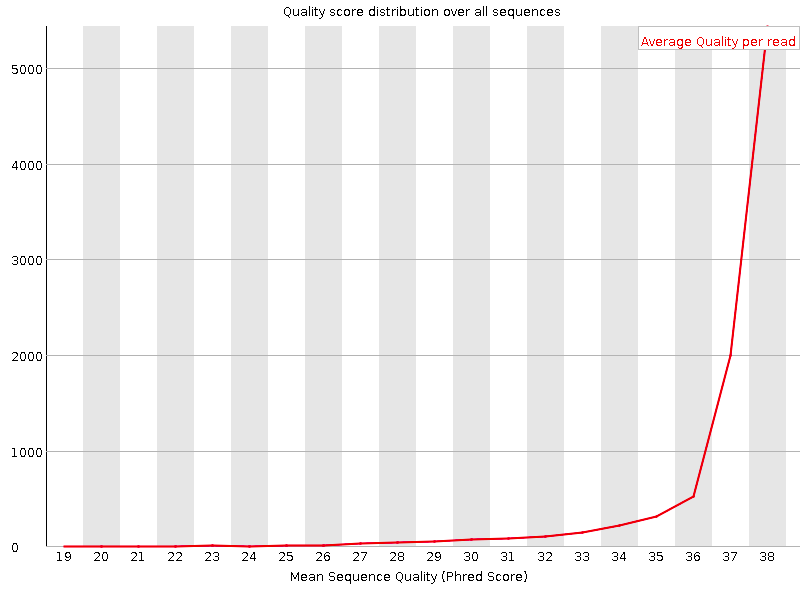
Per sequence quality scores
A plot of the total number of reads vs the average quality score (Phred score) over full length of that read.
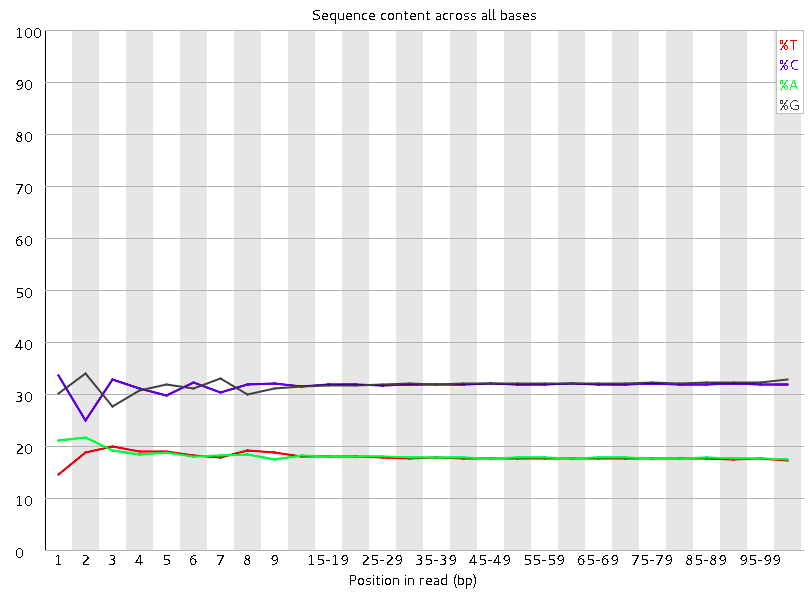
Per base sequence content
This plot reports the percent of bases called for each of the four nucleotides at each position across all reads in the file.
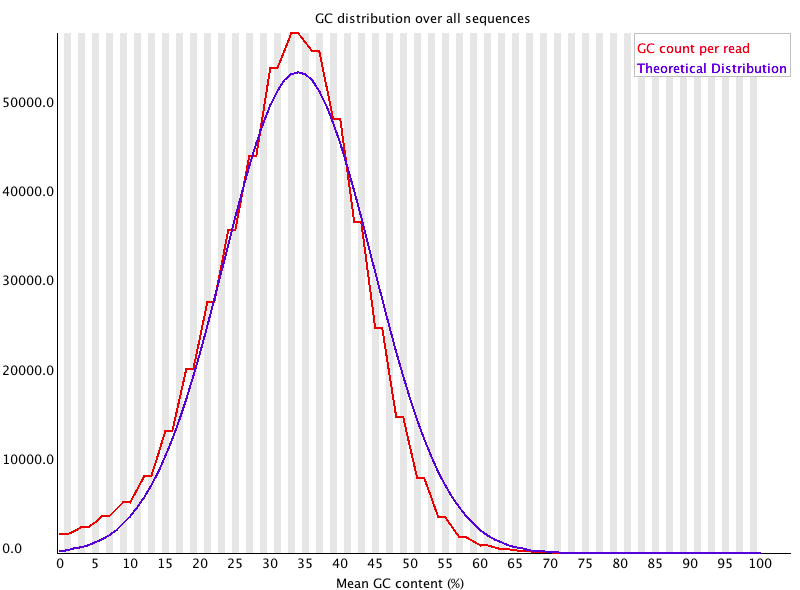
Per sequence GC content
Plot of the number of reads vs. GC% per read. The displayed Theoretical Distribution assumes a uniform GC content for all reads.
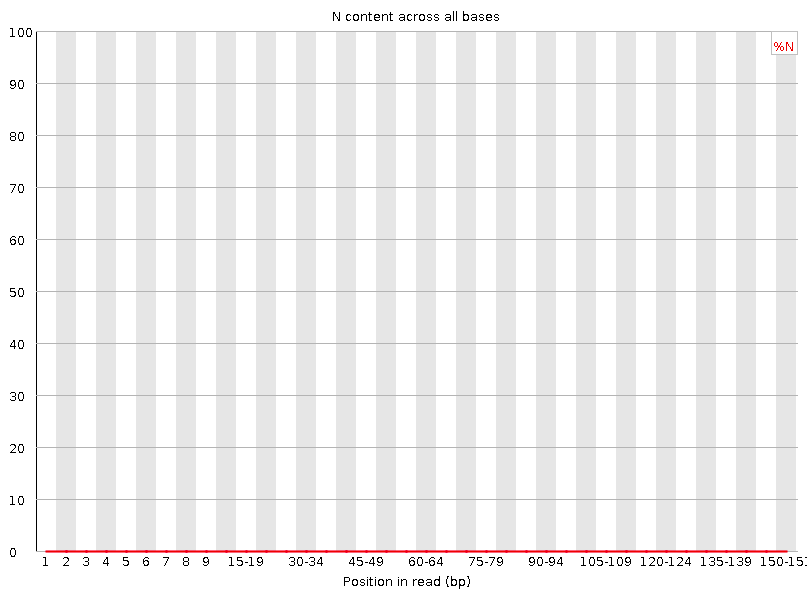
Per base N content
Percent of bases at each position or bin with no base call, i.e. ‘N’.
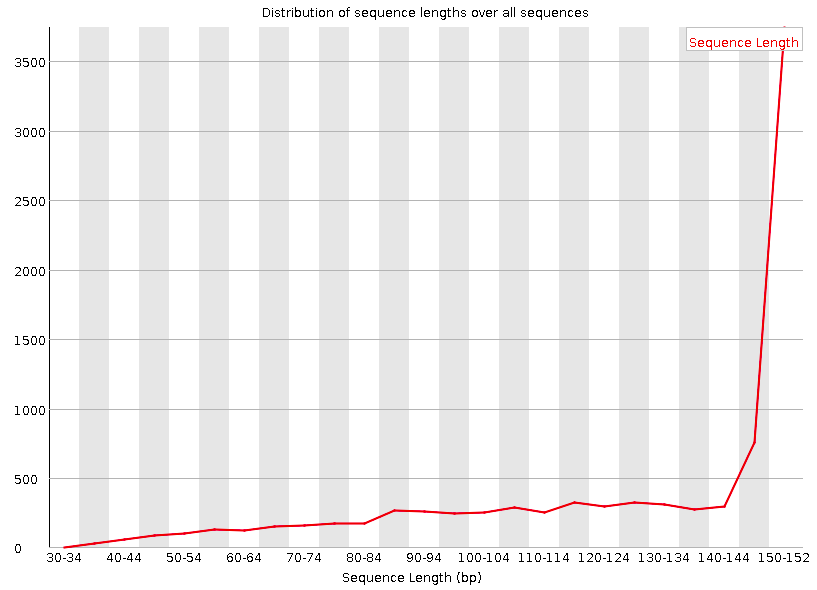
Sequence Length Distribution
Shows the distribution of reads lengths over all sequences.
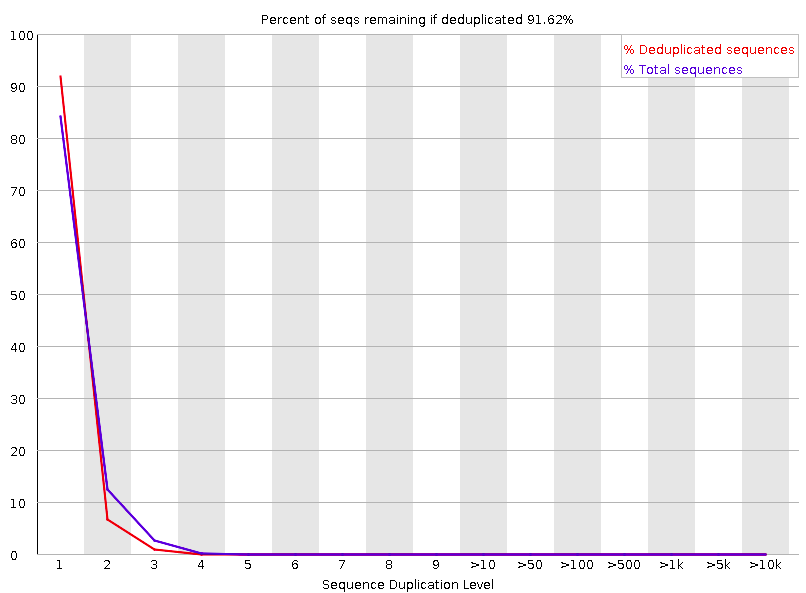
Sequence Duplication Levels
Percentage of reads of a given sequence in the file which are present a given number of times in the file.
Overrepresented sequences
List of sequences which appear more than expected in the file.

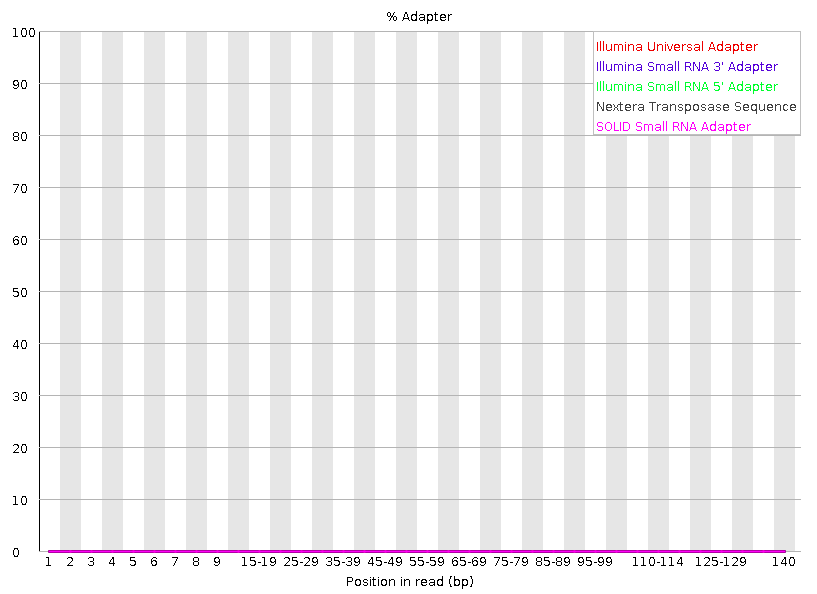
Adapter Content
Cumulative plot of the fraction of reads where the sequence library adapter sequence is identified at the indicated base position.
If an error or warning is reported by FASTQC, VarSome Clinical will also provide a warning to the users. For more information see User messages.