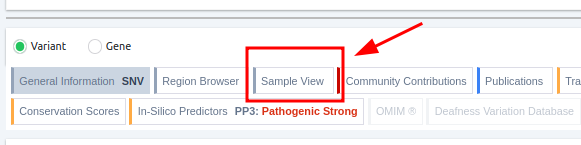
The "Sample View" card presents a genome region browser, but one that is focused on displaying the variants (SNPs, indels, SVs) identified in the current sample.
This sample browser incorporates the following features:
- Conservation scores per position
- A track showing the transcript that was used for the Germline Variant Classification of the selected variant
- More filtering options
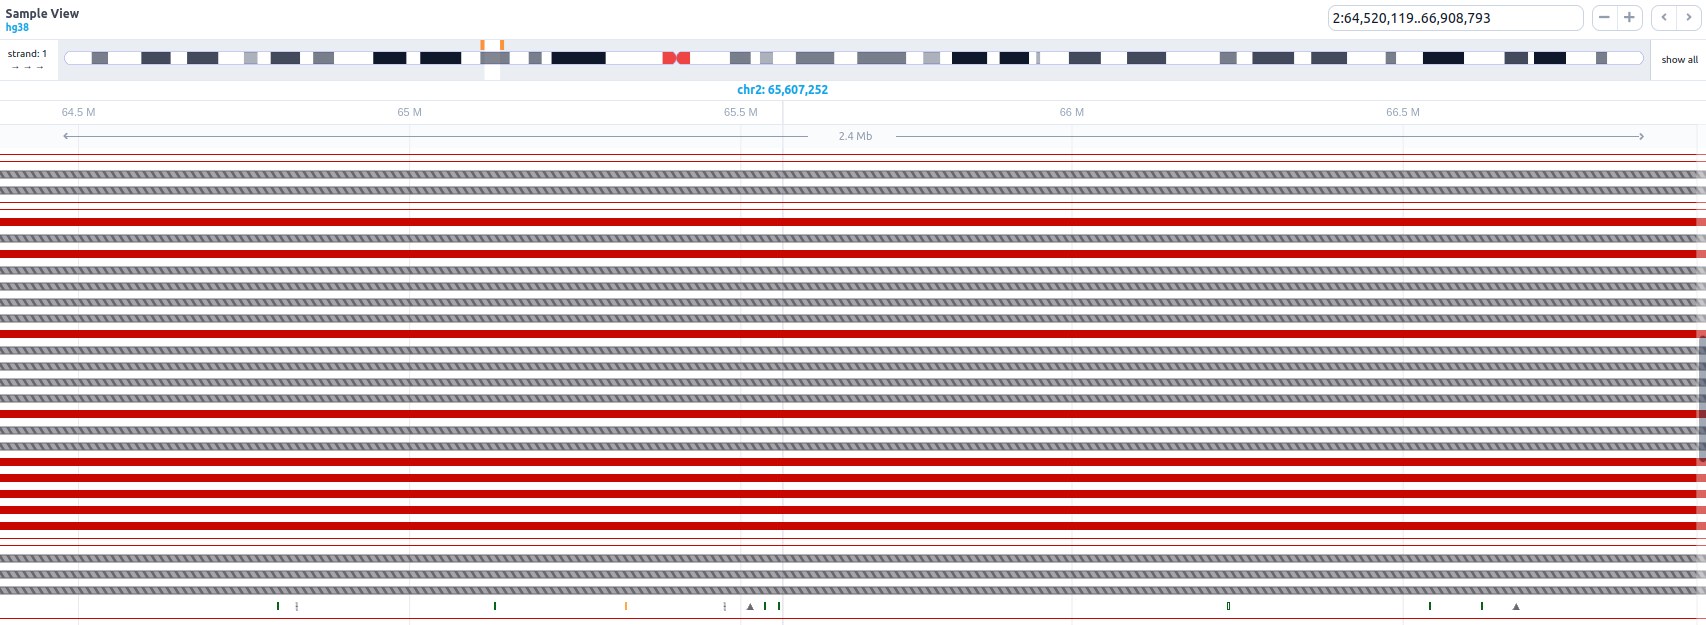
- Ability to switch strand and expand the visualization to all chromosomes to see all analyses' data if the analyses are small enough. (less than 10k variants).
- Touch and gesture support
- Customisable color palette
- 6 track levels:
-
- Chromosome
- Conservation scores
- Transcripts
- Runs of Homozygosity
- Variants in the sample (Single or Multi)
- SVs in the sample
Conservation scores
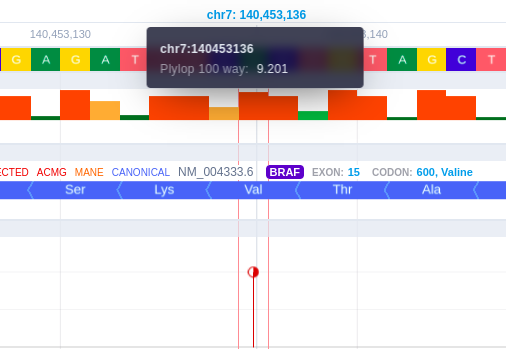
The conservation score per chromosome position is displayed with different colors related to pathogenicity, and its value is presented as a bar. To inspect the conservation scores for a smaller region, the user can zoom in from the corresponding button on the upper right of the browser. When hovering over the conservation bars, the chromosome position is displayed inside a black box alongside the conservation score, provided by the PhyloP software.
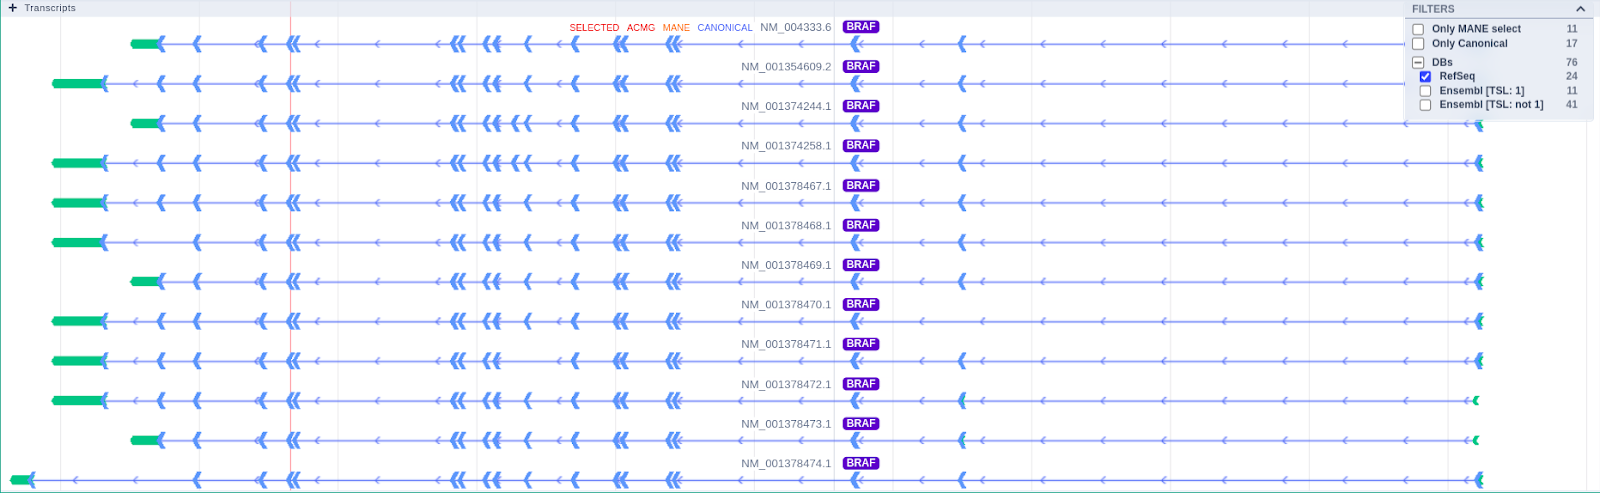
Transcripts
The Transcripts track shows the MANE RefSeq transcript and the transcript selected for the Germline Variant Classification by default. Hovering over the transcript track, the user can see useful transcript-related information such as the source, the transcript reference ID, gene name, exon number, number of codons, and amino acids.
The user can select which transcripts of interest should be displayed by using the filtering options on the top right of the track. Moreover, a transcript of interest can be selected by clicking on the displayed option of the tooltip, and it will be visible regardless of the applied filters.
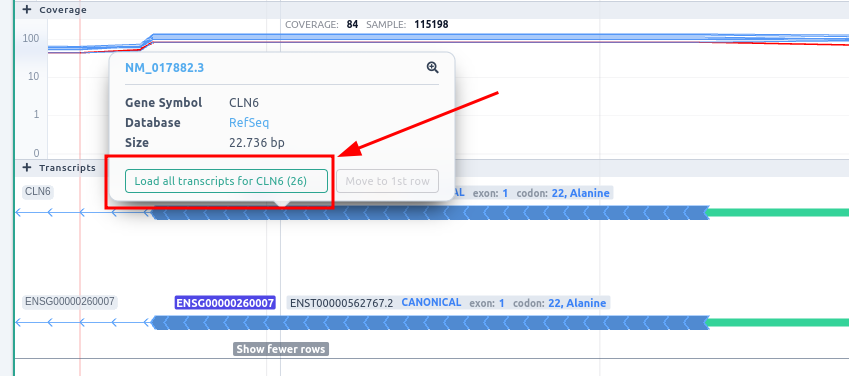
You can see all the transcripts for a specific gene by clicking on the transcript and then on "Load all transcripts for this gene," as illustrated in the picture below.
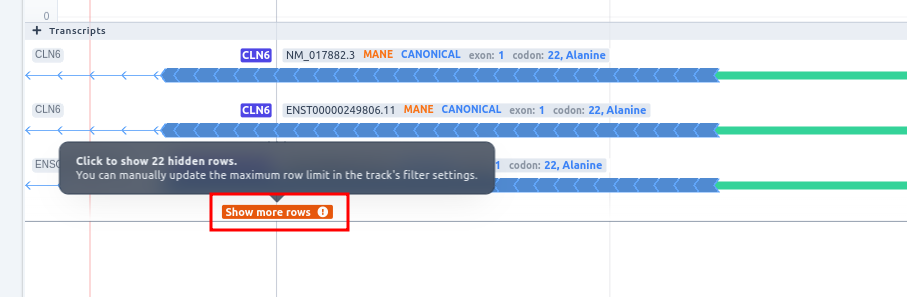
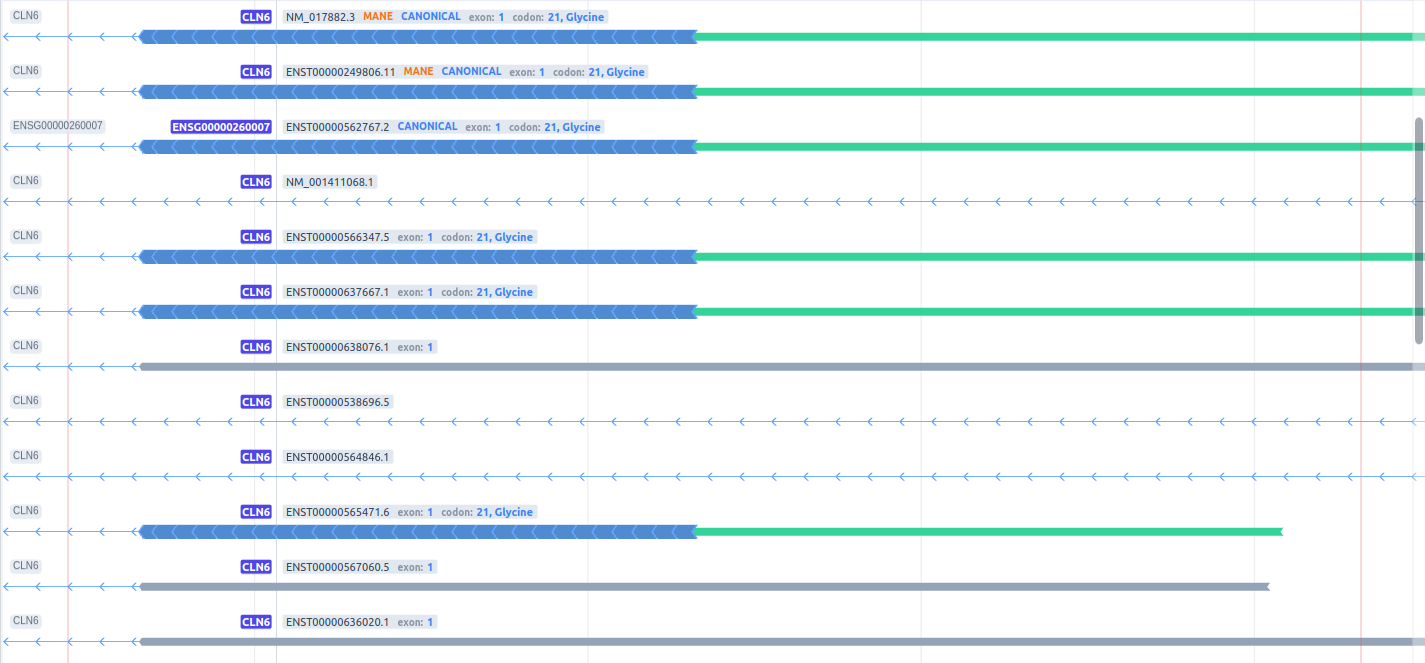
Then you have to select the Show more rows option in order to be able to see the hidden transcripts.
Runs of Homozygosity
The Runs of Homozygosity (ROH) are displayed as bars across the genome. Hovering over the bar will display the start, end and length of the ROH.
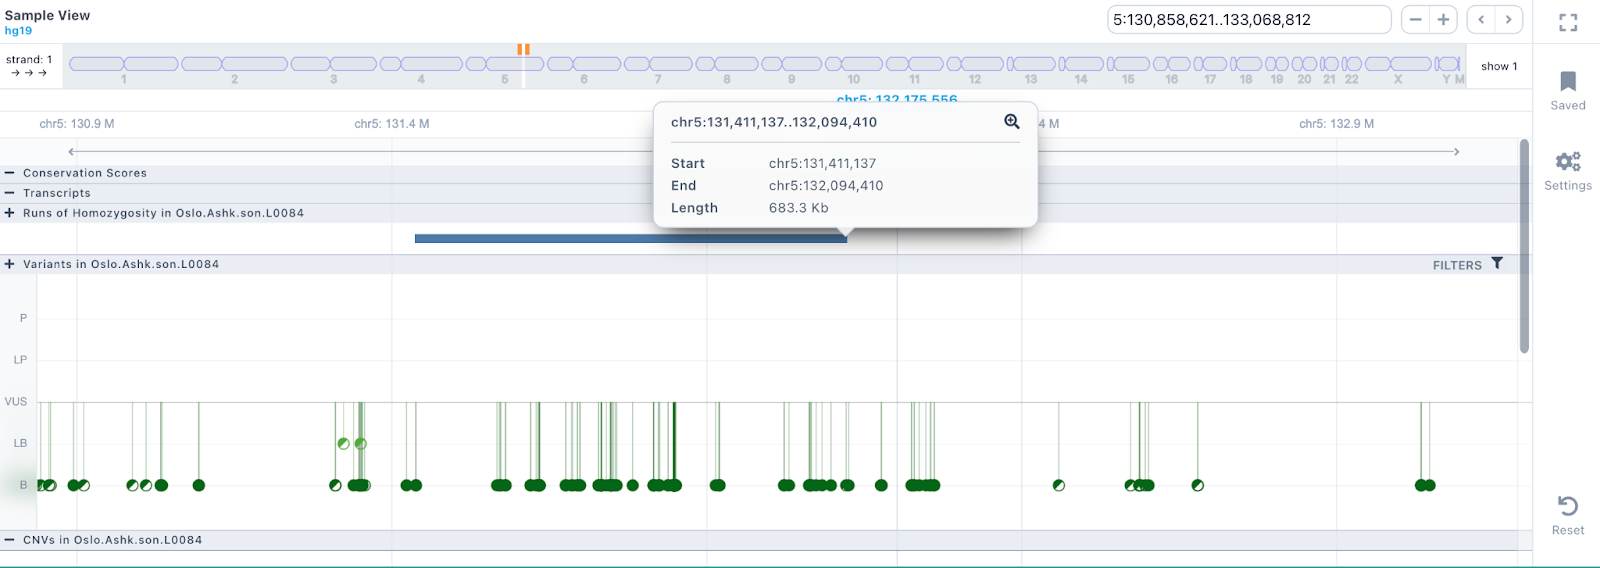
Variants in the sample
The SNVs and indels of the sample are displayed as a lollipop graph with different colors related to pathogenicity. The zygosity state of each variant is presented at the edge of the lollipop display (homozygous variants as filled disks, heterozygous as half-filled), and it corresponds to the one presented in the results table.

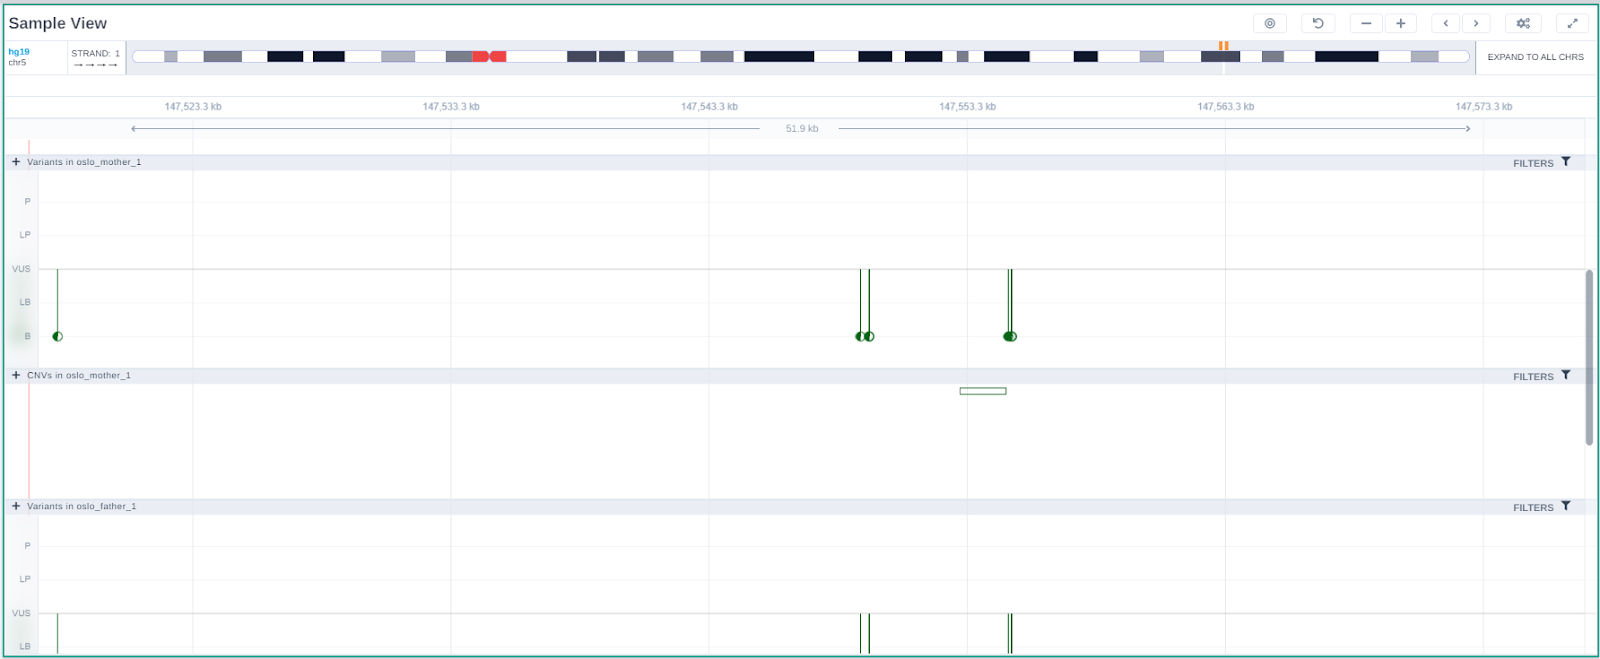
The Sample Browser can be used to visualize variants across all component samples of multi-sample analyses (up to 10 samples).
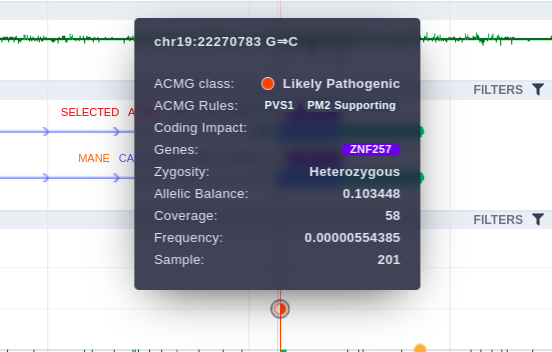
Hovering over a variant, a tooltip is presented containing information about the Germline Variant Classification class, the triggered rules, coding impact, zygosity, allelic balance etc.
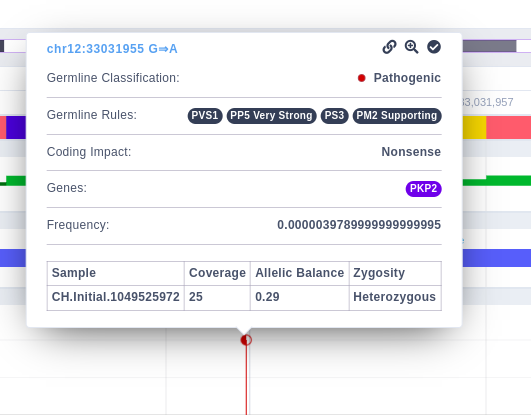
By clicking on the variant, a box is presented providing some additional options, such as a link to open the analysis in which the variant has been identified, a zoom-in option, and one to highlight this variant. It will also display a table with the sample, coverage, allelic balance, and zygosity information.
Single Sample
Multi Sample

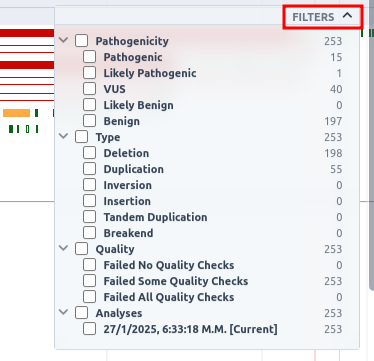
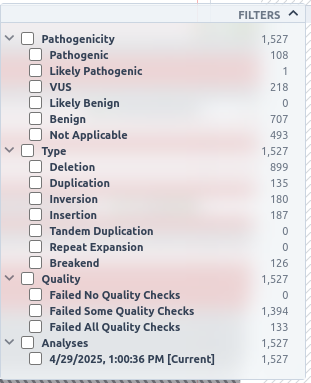
This track can be filtered based on pathogenicity class, zygosity, coding impact, as well as SVs that are present in any other sample, or are present in all other samples, or are not present in the current sample and coverage. To see the available options, click on the filters button on the top right of the track.
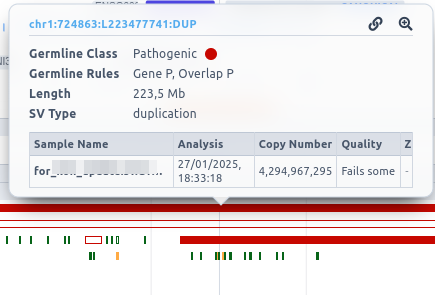
SVs in the sample
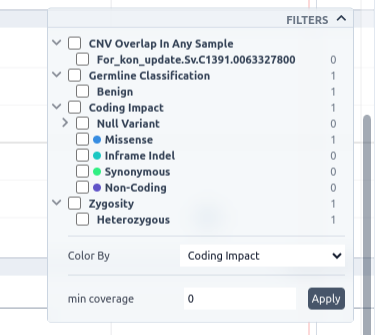
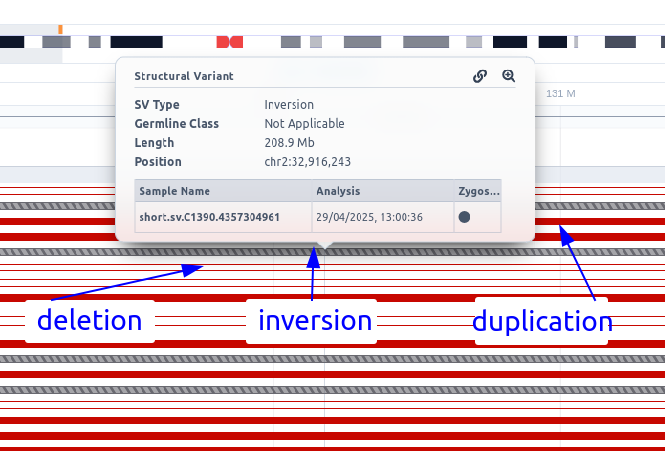
If an SV sub-analysis has been launched for a sample, an additional track will be displayed for the identified SVs. Each SV is colored based on the pathogenicity classification and either filled (insertions) or empty (deletions). Inversions are shown as diagonal-striped grey lines, breakends as three parallel grey lines, insertions as triangles, and repeat expansions as horizontal striped lines colored according to their pathogenicity classification (see below an example of how multiple SV types are shown in the SV track).
Please note that the analysis launched from FASTQ files will only contain CNVs, as we do not perform SV calling.
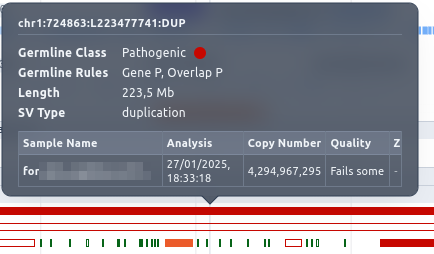
Hovering over an SV, a tool tip is displayed containing information about the Germline Variant Classification class, zygosity, type etc.
By clicking on the SV, a box is displayed providing a zoom option for it.
Additionally, this track can be filtered based on pathogenicity class, type and analyses in which the SVs are identified. To see the available options, click on the filters button on the top right of the track.