Variant table

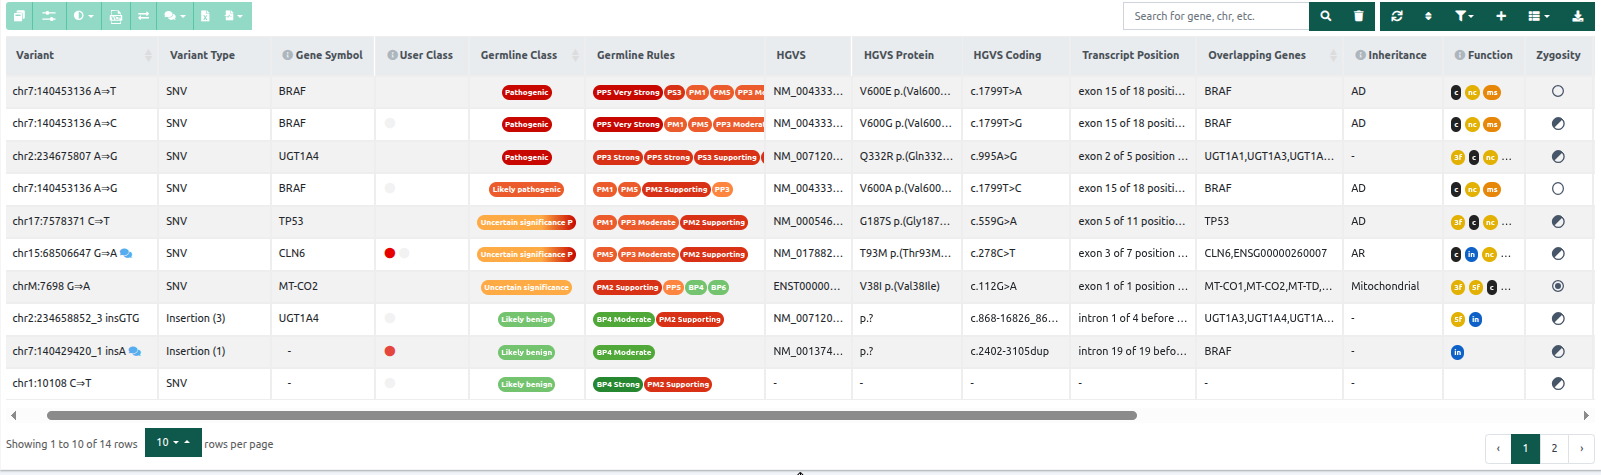
The results are displayed in the Variant Table. Rows contain the identified variants, and columns contain core annotations for each variant (Variant, Variant type, Class, Genes, Function, Zygosity, Allelic balance, and Coverage). However, none of the columns is mandatory, you can choose which ones will be displayed with the "Show/hide columns" icon . The length of each column on the variant table can be adjusted by dragging the sides of the column headers.

Tip: The column order in the variant table is user-specific, meaning each user can set up a custom order and visibility of columns.

You can hover over the info icon next to the column names to display the column information. The variant table is sorted by the ACMG class by default showing the most Pathogenic variants in the first place. You can use the  icon to sort the variant table by other values (e.g. phenotypes, variant position, coverage) in ascending or descending order. Use the “Reset/refresh” icon  to return the variant table to its original state. 

The variant table can be accessed by the user who requested the analysis or by other people belonging to the same group.

Description of main functionalities

Columns for Germline samples

  • Variant: The variant’s sequence and genomic location.
  • Variant type: SNV (single nucleotide variant); for INDELs and substitutions, the number of nucleotides affected is shown.
  • Gene Symbol: Gene used for annotation and classification of the variant for ACMG (& AMP for somatic samples).
  • User variant classification: custom classification for variants. User classifications are also available for AMP and ACMG rules when the user clicks on "Save as manual classification" below the ACMG/AMP verdict. The custom classifications are linked to the variant and will be displayed in other analyses of your group if the same variant is found. See more here: Custom Variant Classifications and Import classifications and comments.
  • CNV: indication that the variant overlaps with a CNV of a sub-analysis.
  • Class: Variants are ordered by our pathogenicity classification:
    • 5 = Pathogenic
    • 4 = Likely pathogenic
    • 3 = Uncertain significance
    • 2 = Likely benign
    • 1 = Benign.
  • ACMG Rules: The set of triggered ACMG rules are displayed in clickable bubble icons that include the rule’s description and explanation for triggering.
  • HGVS: HGVS nomenclature for the variant.
  • HGVS Protein: HGVS nomenclature for the protein sequence change compared to the reference.
  • HGVS Coding: HGVS nomenclature for the variant.
  • Transcript position: Variant described on the DNA level in relation to a specific gene based on the coding DNA reference sequence.
  • Overlapping Genes: The name of any gene(s) the variant falls within.
  • Inheritance: Mode of inheritance of the gene from the CGD database:
    • AD: autosomal dominant 
    • AR: autosomal recessive
    • XL: X-linked
    • BG: blood group
  • Function: The position of the variant with respect to the gene it falls within, and its coding effect (if any).

VarSome Clinical allows the use of custom transcripts for annotation. For more information please refer to: Custom transcript for annotation.

  • Gene Symbol: Gene used for annotation and classification of the variant for ACMG (& AMP for somatic samples).
  • Zygosity:

zygosity

If the variant did not pass the variant caller quality filter, (see FAQs), the zygosity is shown in the table as (failed quality/non-genotyped). 

  • Allelic balance: Proportion of reads that support the variant.
  • Frequency: Frequency of the variant in the general population or (if applied) the specified ethnicity.
  • Coverage: Number of reads that align to the variant’s position. For analyses of fastq samples, the blue numbers contain links to JBbrowse, showing the read alignments at the variant’s position.
  • Filters: filters that have been applied to the data. Filters are associated with the variant calling quality filters that have been applied to the variant to decide whether it has a call status of PASS or FAIL. 

Extra columns for Somatic samples
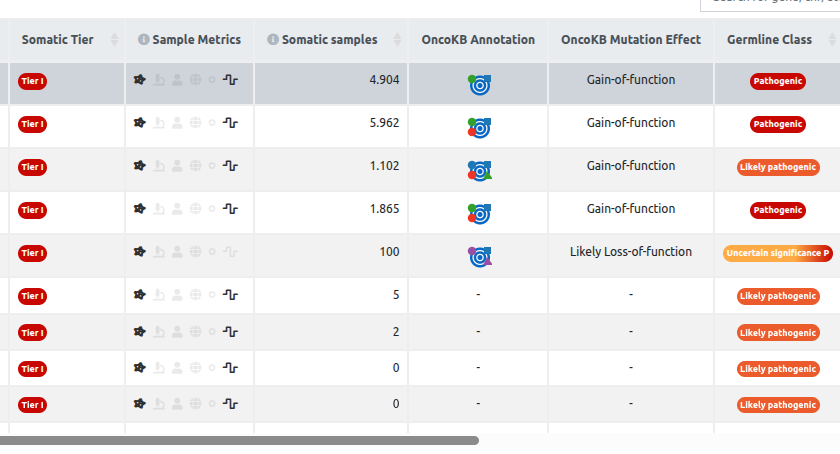
  • AMP Tier: Variants are ordered by an aggregate AMP score (see AMP Implementation documentation for more details), from most pathogenic to benign.  Tier I = Cancer with approved drug therapies, Tier II = Cancer but no approved therapy, Tier III = Uncertain Significance, Tier IV = Benign or not related to cancer.
  • AMP Rules: The set of triggered AMP rules are displayed in clickable bubble icons that include each rule’s description and explanation for triggering
    • Sample Metrics: Each icon represents the sample information introduced by the user. They light up when there is data in one of the cancer-related databases matching the variant to the relevant sample characteristic:
      • Cancer type: this highlights any variants for which evidence is found linking to the same cancer type as the sample.
      • Tissue: This will highlight any evidence associating the variant or gene with the sample tissue.
      • Age: This will display the patient's age relative to an age histogram for certain cancer types.
      • Ethnicity: It will report the variant's frequency in the relevant ethnic group.
      • Sex: more than 50% of reported cases across somatic sample databases match the sample’s sex.
      • Variant Allele Frequency: variants with a low VAF are most likely tumor variants, whilst VAFs of 50% and 100% indicate germline variants.
    • Somatic Samples: Sum of available affected samples from databases included in Cancer Aggregator (ICGC Somatic, COSMIC, CBioPortal, Cancer HotSpots, GDC)

    Clinical cards:

    At the bottom of the variant table, the clinical cards display complementary information about the variant or the gene.

    Variant clinical cards

      • General Information: Information about the genomic location of the variant, its type, cytoband, HGVS notation, and sequence.
      • Community Contributions: VarSome’s community public contributions for this variant.
      • Publications: publications from PubMed related to the selected variant or gene where genes, variants, diseases, phenotypes, chemical compounds, and drugs (if exist) are tagged by our internal AI tool.
      • Transcripts: Chromosomal location, link to UCSC genome browser, dbSNP (rs number), Refseq transcripts containing the variant, HGVS notation, etc. Available transcripts for the selected genes are displayed (information from RefSeq and Ensembl, along with the MANE transcript). The transcript used in classification is highlighted in the Transcripts summary card.

      • Region Browser: Genomic region browser, lollipop graph of the pathogenicity of each variant, frequencies from gnomAD and Bravo, variant visualization with filtering according to databases and coding impact.
      • PharmGKB: Information on the impact of genetic variation on drug response from PharmKGB database.
      • Expression Data: Tissue-specific variant expression data from the Genotype-Tissue Expression (GTEx) project.
      • GWAS: Associations of specific genetic variations with particular diseases from the genome-wide association study (GWAS) database.
      • ACMG Classification: The ACMG Classification and its triggered rules for the selected variant.
      • ClinVar: Information about clinical associated phenotypes connected to the selected variant.
      • Frequencies: If known, Gnomad frequencies for the selected variant and for any other known variants that overlap with it.
      • MitoMap: Information from the Human Mitochondrial Genome Database.
      • Conservation Scores: Conservation scores from different resources.
      • UniProt Variants: Variant information from UniProt.
      • Pathogenicity Scores: Predictions of pathogenicity based on combined evidence from multiple in-silico predictors.
      • ClinGen: Curated data from the ClinGen variants database. Information will be available when the queried variant has already been curated by any of the ClinGen expert panels.
    • Structural Variants: Structural variant browser for the detected variants.
    • Protein Viewer: The 3D protein viewer tool is available to map variants onto the protein structure. By clicking on the “Protein Viewer” card, a new window will open with the 3D Protein Viewer tool. For more information please refer here.
    • Nearby Variants: Variants in the genomic neighborhood of the selected variant. This variant list is not affected by the filters applied to the sample.
    • Clinical: ClinVar and Cosmic annotations for the selected variant and for any other known variants that overlap with it.
    • Population Frequencies: gnomAD frequencies and coverage, from Gnomad Exomes and Gnomad Genomes.
    • #Samples: The number of samples in which a specific variant has been found. This column gets updated daily. The number of homozygotes and heterozygotes in Saphetor for the variants are shown, but only sample IDs of samples analyzed by you and your group are reported. See more here: Sample cross-referencing.
    • OMIM: Information about phenotypes related to the selected variant, as retrieved from Online Mendelian Inheritance in Man®.
    • LOVD: Presents the clinical evidence available from the Leiden Open Variation Database (LOVD) for a given variant and it has also been incorporated into the Germline Classification as a new source of clinical evidence.
    • Multi: Displays the components and their corresponding files used to run the multi-sample analysis, and if these have been selected as affected or not.
    • Audit trail: This shows the record of the actions that have been made by all users of a group on the samples analyzed. Only the group supervisor has access to this information.

    Additional cards for somatic samples:

    • AMP Classification: The AMP tier and the set of triggered rules for the selected variant.
    • JAX CKB: Somatic gene variant annotations and related content provided by The Jackson Laboratory Clinical Knowledgebase.
    • CiViC: Somatic variant annotations retrieved from CiViC.
    • PMKB:  Clinical interpretations of somatic variants retrieved from PMKB.
    • Cancer Samples Summary: Aggregated information across different data sources.
    • Cosmic: Somatic variant annotations from COSMIC database.
    • ICGC Somatic: Somatic variant annotations from ICGC database.
    • Cancer Hotspots: Somatic annotations from Cancer Hotspots database.
    • GDC: Somatic variant annotations from GDC database.
    • cBioPortal: Summary of samples matched in cBioPortal with the selected somatic variant.
    • IARC TP53 Somatic & Germline: Somatic annotations of TP53 gene mutations in human cancers.
    • DoCM: Information retrieved from DoCM, about known, disease-causing mutations associated with the variant.

    Gene clinical cards

    • Gene basic info: Description, synonyms, cytoband, links to clinical or other resources.
    • Transcripts: Strand, chromosomal location, length, mRNA length, UniProt accession number, etc.
    • Publications: Publications from PubMed related to the selected gene where genes, variants, diseases, phenotypes, chemical compounds, drugs (if exist) are tagged by our internal AI tool.
    • Gene function: Functions related to the selected gene, as provided by Genetics Home Reference (GHR).
    • Known gene variants: Variants in the selected gene with known pathogenicity.
    • dbSNFP: Functional prediction and annotation of all potential non-synonymous single-nucleotide variants.
    • GnomAD Genes: Data summary from a wide variety of large-scale sequencing projects associated with the selected gene.
    • EBI Gene2Phenotype: Gene association with a disease entity based on an allelic requirement and a mutational consequence.
    • GenCC: Curated information about the gene-disease relationship.
    • NHI ClinGen Disease Validity: Gene-disease association validity information.
    • DOMINO: Probability of the selected gene to cause dominant changes.
    • PanelApp gene lists:  Catalog of available gene panels including the selected gene.
    • Clinical Genomic Database: Age affected, condition, inheritance, indicated intervention categories, publications as retrieved from Clinical Genomic Database.
    • Human Phenotype Ontology: Disease and their phenotypic abnormalities associated with the selected gene.
    • Human Protein Atlas: Protein expression information by cell and tissue type 
    • Fusion GDB: Functional annotation of fusion genes in cancer and their related drugs
    • Gene Expression: Tissue-specific gene expression data from the Genotype-Tissue Expression (GTEx) project.
    • Protein Viewer: The 3D protein viewer tool is available to map variants onto the selected protein structure. By clicking on the “Protein Viewer” card, a new window will open with the 3D Protein Viewer tool. For more information please refer to here.
    • JAX CKB: Evidence and clinical trials content related to the selected gene as provided by The Jackson Laboratory Clinical Knowledgebase.
    • OMIM: Information about phenotypes related to the selected gene, as retrieved from the Online Mendelian Inheritance in Man®.
    • PharmKGB: Information on the impact of genetic variation on drug response from PharmKGB database.
    • FDA: Approved drugs associated with the selected gene, from FDA.
    • DGI: Information about drug-gene interactions interpreted by the “Drug Gene Interaction” Database.
    • CPIC: CPIC levels to genes/drugs retrieved from “Gene Drugs Interactions and Levels”
    • AACT Clinical Trials: Information about every clinical study registered in ClinicalTrials.gov associated with the selected gene as provided by AACT.
    • Community Contributions: VarSome’s community public contributions for this variant.

    Additional cards for somatic samples:

    • CiViC: Cancer-related clinical evidence as derived from CiViC database. 
    • PMKB: Clinical interpretations of gene variants retrieved from PMKB.
    • Cancer Gene Census: Information about gene’s mutations that are causally implicated in cancer as retrieved by COSMIC database.

    Please, note that grayed out tabs are disabled if no related information is available

    Current annotation

    VarSome provides “Current Annotation” of germline variants using the latest data and the latest ACMG classifier. This feature allows you to see whether additional data are available for a variant and whether the automated classification is altered by new evidence or refinements to the classifier. This feature is provided for research purposes only in VarSome Clinical.

    Original view:

    Current annotation view:

    Compact view

    It is possible to make these cards much smaller by clicking on the “Display Options” wheel on the top right-hand side of the cards panel, and selecting “Compact View”. This removes the summary data from the cards and reduces their size.

    Some useful icons:

    • Click on this box to get access to your saved filter sets: 
    • Click on the arrow icon to see the list of variants selected for export.
      You can download a clinical report of the selected variants in PDF format. To do so, click on the arrow icon, then select "Generate Report" 

      and you will be directed to the following screen.

      By clicking on the icon, a Report widgets menu will be shown in order to customize your report.

      You can drag and drop the information you prefer to include in the report. At the last option  you can find PMKB information for the gene that includes the variant. For further information please see more in the corresponding article: Report Generation.

    Green menu:

      • Search: You can search through your results by querying according to the VarSome search format. The query can include any of the following: 
        • gene: e.g. PIK3CA,
        • chromosome: e.g. chr3 or 3
        • chromosome position: e.g. chr3:178947865, chr3-178947865, chr3 178947865 or 3 178947865.
        • genomic range: e.g. chr3:178936091:178942431, chr3-178936091-178942431,  chr3 178936091 178942431 or 3 178936091 178942431.
        • variant (DNA): e.g. chr3:178936091 G⇒A, chr3:178936091-G-A, chr3-178936091-G-A, chr3 178936091 G A, 3:178936091 G⇒A, 3:178936091-G-A…
        • variant (HGVS): e.g. NM_004448.4:c.1947-3C>A
        • variant (protein): e.g. BRAF:V600E or BRAF V600E.
        • rsIDs ("rs" followed by a number) 
        • COSMIC IDs

      This will filter the table and show only the results for that query.

      • Clear search: This will empty the search box and show all variants again. 
      • Reset variant list to original order: Clicking on this icon resets the sorting order of the columns to the default (the variants will be ordered by Class). 
      • Multiple sort: The list of variants can be sorted by multiple columns. A pop-up window will appear and multiple columns of interest can be selected in order to sort the variants in ascending or descending order.

      Note: Multiple-column sorting will return informative results as long as the first column, which is selected to sort the variants, has numeric values (Frequency, number of samples, Phenotypes etc). For example, the user should not sort first by “AMP Tier” or “ACMG Class” and then sort by other values like allelic balance, frequency, etc. However “ACMG Class” and “AMP Tier” can be used as second or later in the order of columns to sort by.

      • Display variants matching classification: Filters for custom variant classifications.
      • Add or edit your variant classifications: Open the Custom Tag creation menu. Custom tags allow you to classify variants using user-defined tags.
      • Columns: Remove or add columns to the table. This functionality can be used to remove columns that are not relevant for the analysis. 
      • Download all filtered variants from the table below (max 50000) in Excel format: Download the list of variants (max. 50000) that pass any currently applied filters in Excel format. The Excel file also contains information about the filters used to obtain the exported table.

      Blue menu:

      • Open results in linked window: This functionality allows you to utilize multiple screens by generating "linked" sub-windows that contain the results of an analysis. (please find detailed information in the following article: How can I inspect my analysis results on more than one monitors?)
      • Classify variants: add your own classification to a variant.
      • VCF attributes: pop-up window describing the quality details for each software tool used to identify the variants.
      • Transcripts: pop-up window with all the RefSeq transcripts containing the variant. It also shows the location of the variant (intron/exon, amino acid position), its HGVS notation, and genomic function (intronic, exonic, splicing, UTR ...). Canonical transcripts are shown in red.
      • Comments: It is possible to attach a short comment to a selected variant (long comments will not be added and will return an error message). These comments will be linked to the variant or the gene and will be displayed in other analyses if the same variant is found. Variants with comments will have an icon in the Variant or Gene column. Comments are shared only within your group unless you decide to make your comments public by selecting the “Share comment outside your group” option. You can also select the “The comment is specific to this sample only” option and the comment will be available only to this specific sample analysis. If however, the variant is present in other analyses, the sample-specific comment will not be shown.


      • View in VarSome: link to our free knowledge base and database aggregator, VarSome.
      • Select for export: Clicking on this box selects the variant for export, and information about the variant can be exported in Word and Excel format ("Export variant list" box)


      • Gene coverage: a pop-up window showing the average coverage for the selected gene and its different transcripts. Clicking on the nodes will expand or collapse the tree.

      img8

      Also, by clicking on one of the Exons, a new tab will open with a Jrowse (jbrowse.org) window showing the alignment details from the analysis’ bam files. JBrowse is a software tool installed on our secured servers.

      img9

      • Read Alignment: Opens a new tab with a JBrowse representation of the BAM files (more in FAQs: What is represented in JBrowse?)

      Analysis actions: is described here

      Description of CNV analyses' functionalities

      CNV/SV analysis Variant Table contains the following information:

        • Length: the length in bp of the region considered as a structural variation.
        • Call quality: Three quality control metrics were collected for CNV analyses starting from FASTQ data (e.g. WES or gene panel). Each CNV call is assigned a set of three “traffic lights”, which are colored green or red, depending on meeting the quality control criteria. The first and second traffic lights will be greyed out for CNV results of analyses starting either from VCF or WGS data. From left to right, these are:
        • Test sample coverage: this quality control metric ensures a minimum coverage of the test sample at the CNV call region when calling duplications. Green: duplications with coverage at least equal or higher than the minimum coverage threshold* (please note that all deletions pass this filter and therefore will always have a green colour). Red: duplications with coverage lower than the minimum coverage threshold.
        • Number of reference samples: this is to ensure that a minimum number of samples from the reference set have a minimum coverage* in the CNV call region. Green: the reference sample set has at least two samples with coverage higher than the minimum coverage threshold, in the CNV region. Red: fewer than two reference samples with sufficient coverage in the CNV call region*.
        • CNV call overlapping camouflaged region: this is to check whether an overlap exists between the region of the CNV and the Camouflaged Regions. Camouflaged regions contain duplicated genomic sequences where confidently aligning short reads to a unique location is not possible.  Green: no overlap. Red: overlap with a Camouflaged Region (Ebbert et al., 2019)

      *Minimum coverage threshold (number of reads): the lowest value between 10 or sample median coverage/10.

      • User CNV classification: custom classification for CNV variants for ACMG and AMP rules. For user-submitted VCFs with CNVs, only variants with a copy number value can be manually classified.
      • Copy Number: estimated copy number of the CNV call calculated from the reads expected vs reads observed ratio assuming a diploid state.
      • Type: deletions, duplications, copy number variants and insertions.
      • Genes: genes overlapping the CNV region.
      • Number of genes: number of genes overlapping the CNV call region.
      • Quality Score: a measure of statistical support for each CNV call. Specifically, it is the log10 of the likelihood ratio of data for the CNV call divided by the null (normal copy number). The higher the Quality Score the more confident one can be about the presence of a CNV. While it is difficult to give an ideal threshold, and for short calls, the scores may be unconvincing, the most obvious large calls should be easily flagged by ranking them according to this score.
        • For CNVs from VCF, provided for annotation only, the Quality Score displays the QUAL value from the VCF (if included).
        • For WGS CNV analyses, it is the quality score as given by  DELLY.
      • ACMG CNV class and CNV rules: the ACMG CNV classification and the set of triggered ACMG rules. These rules are displayed in clickable bubble icons that include the rule’s description and explanation for triggering.
      • Number of exons: number of exons overlapping the CNV region.
      • Reads expected, reads observed and reads ratio: these columns contain the values for each CNV of the reads expected, the reads observed, and the read ratio (reads observed/reads expected). 
      • Frequency: Frequency of overlapping CNVs in the same genomic region. The gnomAD database is used to get the general population frequencies for a given structural variant. Depending on the type of variant, the frequencies are calculated as follows:
        • Deletions: we use gnomAD variants if they fully overlap with the given variant.
        • Duplications in coding regions: we compare at the gene level and we use those gnomAD variants that encompass the same coding genes as the given variant.
          • Duplications in non-coding regions: we use gnomAD variants if they are at least covering 85% of the variant region.

        CNV tabs

        • Genes: the gene information for all the genes overlapping the CNV region is available at the right side of the window under the “Gene” option.

        • Transcripts: A list of all the affected transcript positions that overlap with each CNV is displayed on the right of the Variant Table, under the "Transcripts" tab.

        • ACMG: in this tab, we show the ACMG CNV classification and the set of triggered ACMG rules. Click on “Show full detail” to find out the criteria not met.
        • CNV Browser: an interactive browser showing a wider region around the position of the CNV call as well as its location on the chromosome level. The user can zoom in and out using the mouse scroll and select among different chromosomes, genomic positions, samples and CNV calls. Data points represent read ratios (observed/expected read counts). These are colored blue or red, depending if they fall within the purple-shaded area 95% confidence interval or not, respectively. Call genomic location is indicated by coordinates and annotated for overlapping gene structures (exons/introns). The coverage track, at the bottom of the interactive plot, shows the trend of the coverage on a logarithmic or linear scale across all cohort samples. By hovering the browser, there is useful CNV call information including genomic location and span, as well as links to the same region in other analyses of the same cohort.

        • CNV plots: we provide a CNV plot, showing how the observed read depth in the area of the CNV differs from the expected. The CNV plots are generated using a modified version of the ExomeDepth tool. You can find further information regarding CNV visualization.
        • Known CNVs: we display only the relevant CNVs for the classification according to the following criteria: 
          • CNV deletions: we retain those that fully overlap with the given CNV for gnomAD variants. For CNVs coming from clinical sources (Decipher, DBVar, ClinVar CNVs) we use the overlapping CNVs if they are benign and the contained CNVs if they are pathogenic.
          • CNV duplications: we keep only the CNVs encompassing the same coding genes. If the CNV is non-coding, then we retain the CNVs that have at least 85% of overlap. 


          Searching through CNV results

          As you inspect the CNV results of your sample, you can search by a known, or previously detected from the main analysis of the sample, SNV or small INDEL and see if it overlaps with any detected CNV.