SV Variant Table
The SV analysis Variant Table contains the following information:
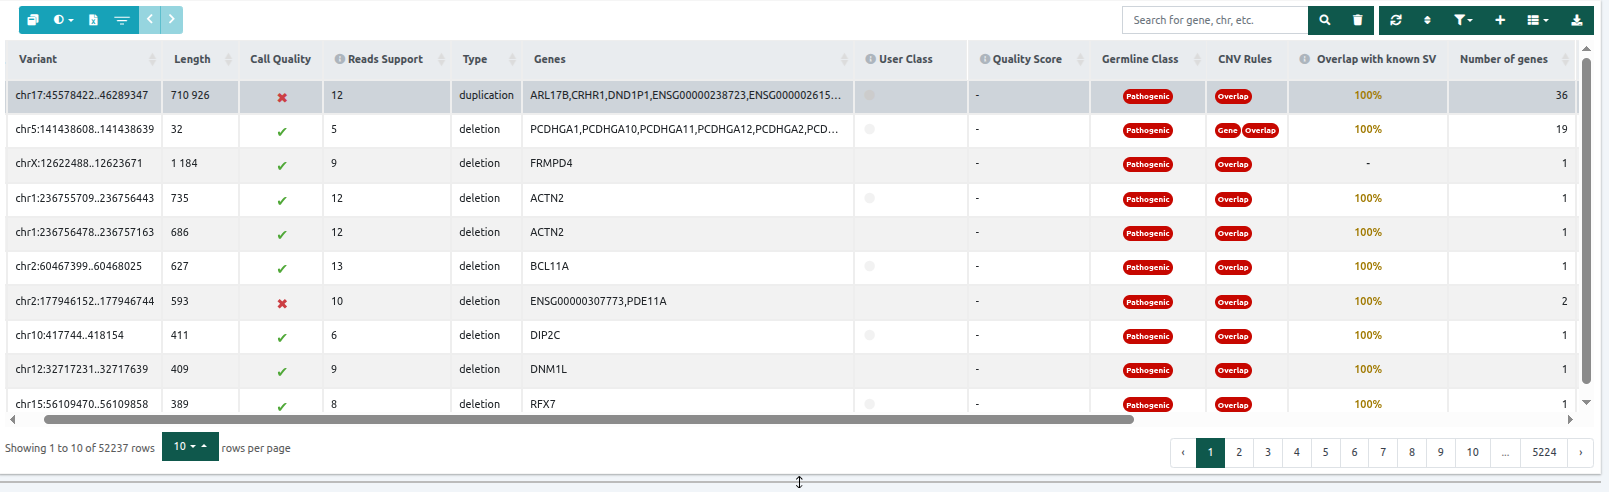
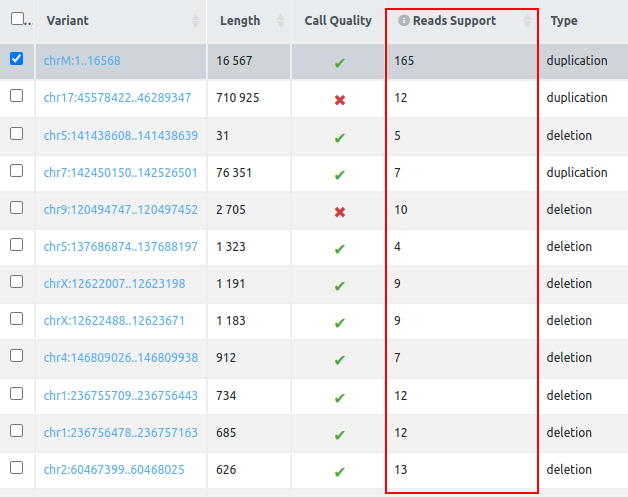
- Length: the length in bp of the region considered as a structural variation.
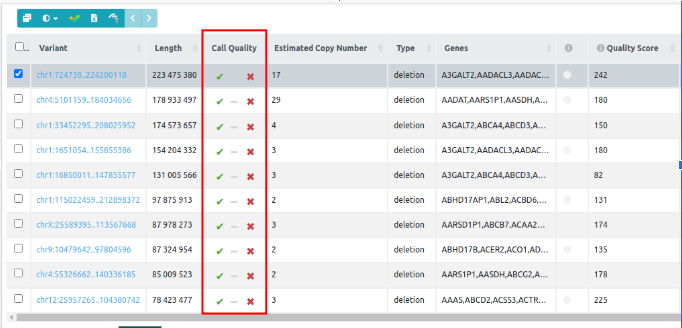
- Call quality: Three quality control metrics were collected for CNV analyses starting from FASTQ data (e.g., WES or gene panel). Each CNV call is assigned ticks, green, and “X”s, red, so at a glance, you can see which have passed and failed the quality checks. The first and second metrics will have a grey dash for CNV results of analyses starting from either VCF or WGS data. From left to right, these are:
- Test sample coverage: This quality control metric ensures a minimum coverage of the test sample at the CNV call region when calling duplications.
- Green: duplications with coverage at least equal to or higher than the minimum coverage threshold*.
- Test sample coverage: This quality control metric ensures a minimum coverage of the test sample at the CNV call region when calling duplications.
⚠️ Please note that all deletions pass this filter and therefore will always have a green colour.
-
-
- Red: duplications with coverage lower than the minimum coverage threshold.
- Number of reference samples: This is to ensure that a minimum number of samples from the reference set have a minimum coverage* in the CNV call region. Green: the reference sample set has at least two samples with coverage higher than the minimum coverage threshold in the CNV region. Red: fewer than two reference samples with sufficient coverage in the CNV call region*.
-
*Minimum coverage threshold (number of reads): the lowest value between 10 and the sample median coverage/10.
-
- CNV call overlapping camouflaged region: This is to check whether an overlap exists between the region of the CNV and the Camouflaged Regions. Camouflaged regions contain duplicated genomic sequences where confidently aligning short reads to a unique location is not possible. Green: no overlap. Red: overlap with a Camouflaged Region (Ebbert et al., 2019).
⚠️ Please note that for SV analyses starting from VCF, the Call quality column only contains information about the CNV call overlapping the camouflaged region.
- User Class: Custom classification for CNV variants for ACMG and AMP rules. For user-submitted VCFs with CNVs, only variants with a copy number value can be manually classified.
- Estimated Copy Number (For CNV analyses starting from FASTQ): ExomeDepth infers copy number variants (CNVs) in exome sequencing data by comparing the observed read counts in a test sample to an expected reference, modeling the counts using a beta-binomial distribution (Plagnol et al., 2012). Although ExomeDepth does not explicitly report absolute copy numbers, the method assumes that read depth is proportional to underlying copy number, a standard assumption in read-depth–based CNV detection. This proportionality implies that the copy number can be approximated by scaling the normalized read ratio (i.e., the observed/expected read depth) by 2, which represents the expected read depth for a diploid region.
Therefore, we estimate:
Estimated Copy Number ≈ 2 × (observed read depth/expected read depth)
This approach is consistent with the ExomeDepth model, where CNVs are called based on significant deviations from the expected diploid coverage, and the normalized ratio serves as a surrogate for underlying copy number changes. - Type: type of SV, can be deletion, duplication, insertion, inversion, or breakend.
- Genes: genes overlapping the CNV call region.
- Number of genes: number of genes overlapping the CNV call region.
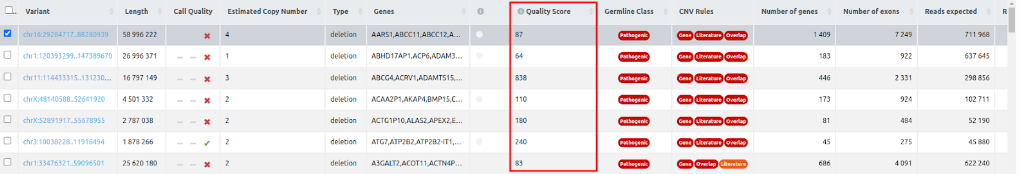
- Quality Score: A measure of statistical support for each CNV call. Specifically, it is the log10 of the likelihood ratio of data for the CNV call divided by the null (normal copy number). The higher the Quality Score, the more confident one can be about the presence of a CNV. While it is difficult to give an ideal threshold, and for short calls the scores may be unconvincing, the most obvious large calls should be easily flagged by ranking them according to this score.
- For WGS CNV analyses, the quality score is given by delly if it is a single sample, or by ExomeDepth for multiple samples.
- For SVs from VCF, provided for annotation only, the Quality Score displays the QUAL value from the VCF (if included).
- Germline CNV classification and CNV rules: the Germline CNV classification and the set of triggered ACMG rules. These rules are displayed in clickable bubble icons that include the rule’s description and explanation for triggering.
⚠️Please note that inversions, insertions, and breakends will not have any Germline classification.
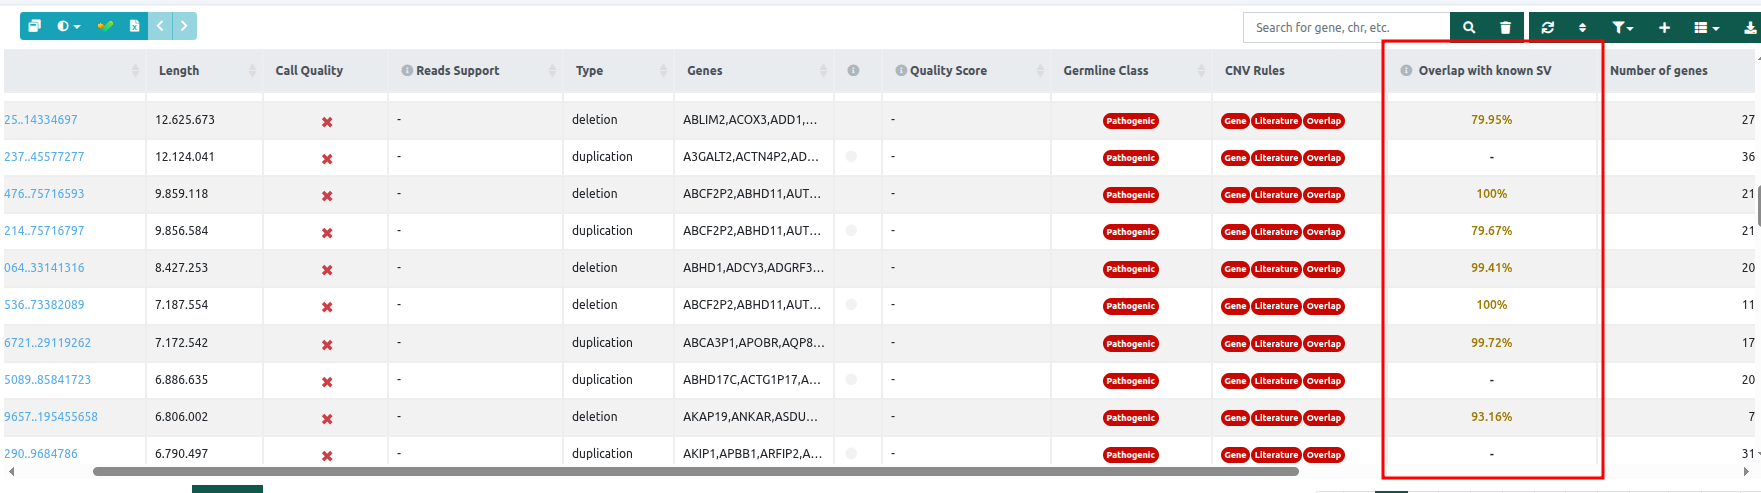
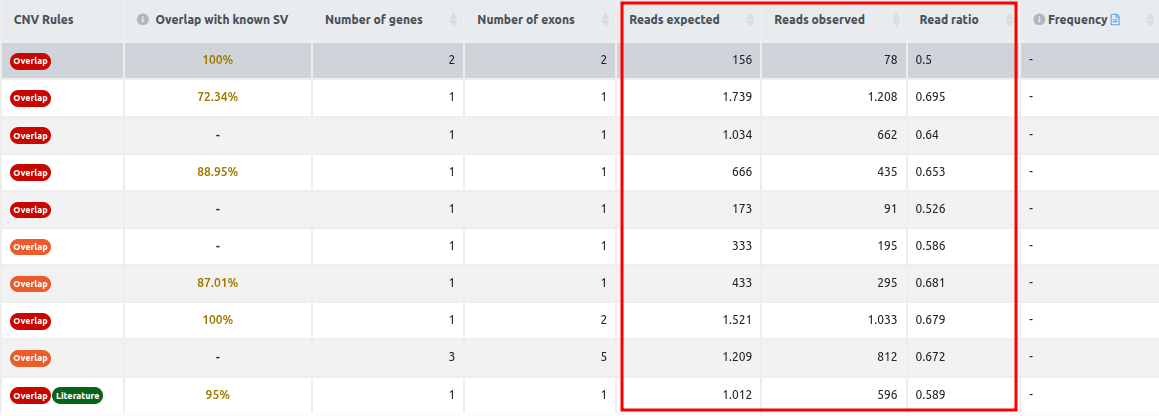
- Overlap with known SV: displays the percentage overlap with known structural variants (SVs) in a dedicated column within the SV table. Known SVs are retrieved from several data sources, like ClinVar, Decipher, DGV, dbVar, Children’s Mercy research institute, Ira Hall Lab, HPRC, and estd20. This feature is available for CNV analysis from WGS, WES, as well as tertiary SV analysis from VCF files. More information about the Overlap with known SV column and card can be found in the document Overlap with known SV.
⚠️ Please note that this functionality is currently restricted to CNV variants. Consequently, data will not be available in this column for other types of structural variants, such as insertions or inversions.
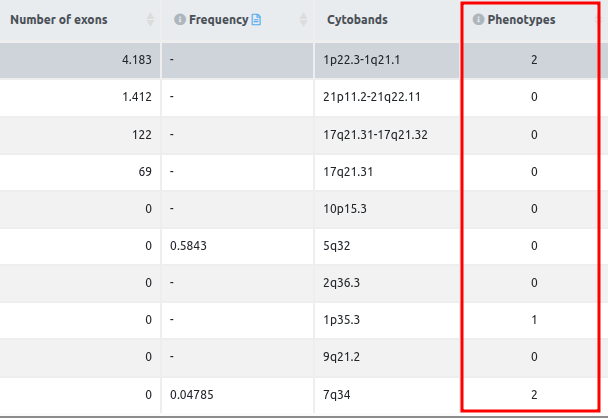
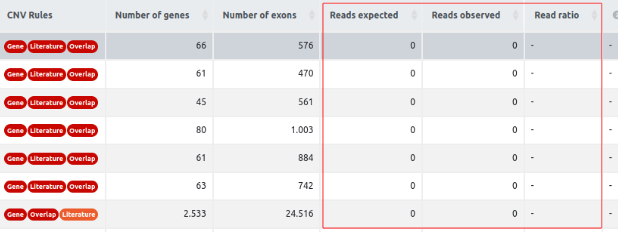
- Number of exons: number of exons overlapping the CNV region.
- Reads expected, reads observed, and reads ratio (For CNV analyses starting from FASTQ): these columns contain the values for each CNV call of the reads expected, the reads observed, and the read ratio. The column read ratio is calculated by dividing the number of observed reads by the number of expected reads. Since the number of expected reads is calculated from the reference set of samples, we highlight the importance of having an appropriate reference set, as we mentioned in the QC report section. Given a good reference set of samples with a good correlation between them, and all three call quality metrics passing the filters, the read ratio value can be used to rank the variants according to the strength of the signal.

- Reads Support (for SV analyses starting from VCF only): Number of reads that support the structural variant. This value is extracted from the Oxford Nanopore Technologies and PacBio VCF files: from the “SUPPORT” field in Oxford Nanopore Technologies data and from the “AD” field in PacBio data.

- Frequency: frequency of overlapping CNVs in the same genomic region. The gnomAD database is used to get the general population frequencies for a given structural variant. Depending on the type of variant, the frequencies are calculated as follows:
- Deletions: We use gnomAD variants if they fully overlap with the given variant.
- Duplications in coding regions: We compare at the gene level, and we use those gnomAD variants that encompass the same coding genes as the given variant.
- Duplications in non-coding regions: We use gnomAD variants if they cover at least 85% of the variant region.
- Cytobands: The cytoband of each CNV is displayed. Long CNVs spanning more than one cytoband are displayed as a range.
- Zygosity: This column is displayed for analyses conducted with Delly (WGS single-sample CNV analysis).
- Phenotypes (in SV and CNV analyses if the user adds in the main analysis phenotypes): This column contains the number of user input phenotype(s) associated with the variant gene. More information can be found in the document Phenotype Matching.

- Delly precision: This column is displayed for analyses conducted with Delly (WGS single-sample CNV analysis). It takes two possible values: “PRECISE” or “IMPRECISE”. The Delly caller leverages both read depth and split read support to call CNVs. CNVs called based only on read depth data are IMPRECISE, while calls based on both read depth and split reads are PRECISE.
Please note that the analysis launched from FASTQ files will only contain CNVs, as we do not perform SV calling.
SV Cards
- Genes: the gene information for all the genes overlapping the SV region is available on the right side of the window under the “Gene” option.
![]()

- SV Details: Summary information about the selected variant (position, type, overlapping genes, etc)
- Sample View: The sample's region browser presents information about the overlapping transcripts in the CNV region, conservation scores per position, and SNVs of the sample. For further information, please refer to the section Sample View.
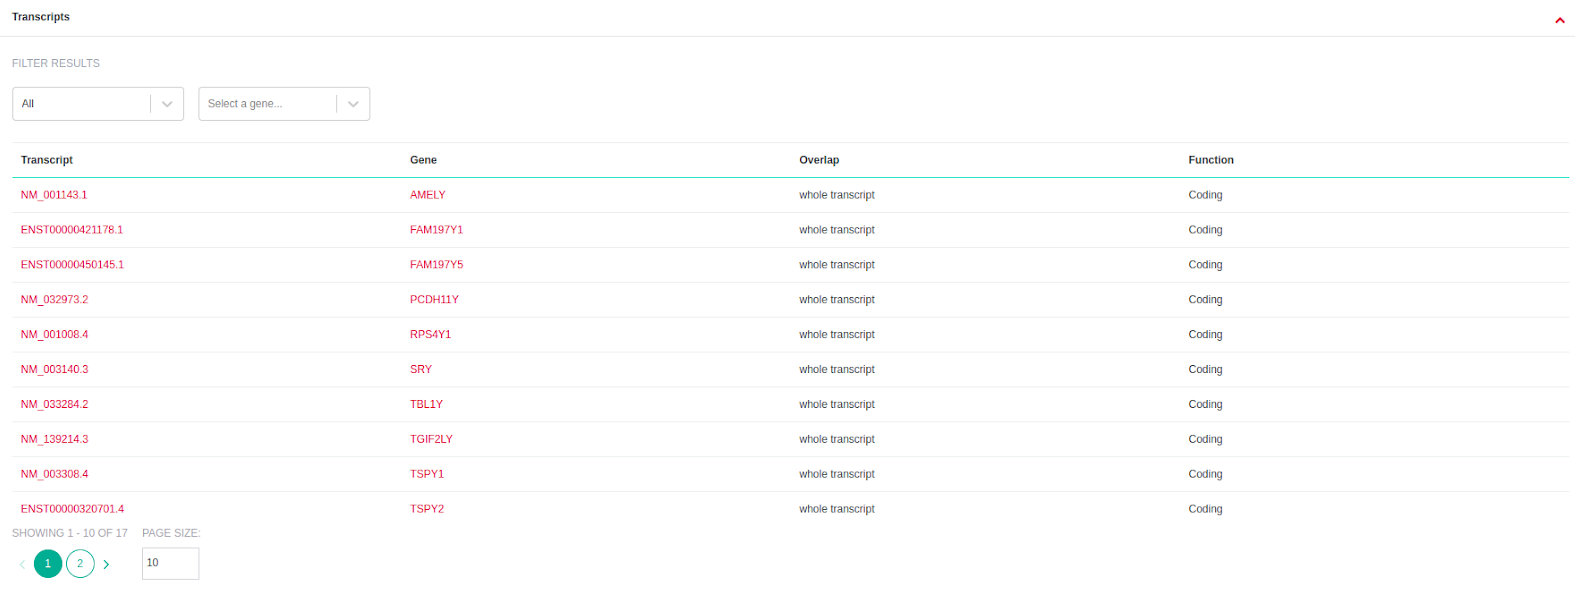
- Transcripts (available only for CNV analyses): A list of all the affected transcript positions that overlap with each CNV is displayed on the right of the Variant Table, under the "Transcripts" tab. Transcripts can be filtered based on coding status and/or gene name.
- CNV Classification: In this tab, we show the Germline classification for each CNV and the set of triggered ACMG rules. Click on “Show full detail” to find out the criteria not met.
- Publications: publications from PubMed related to the selected CNV or genes where variants, diseases, phenotypes, chemical compounds, and drugs (if applicable) are tagged by our internal AI tool, as well as from the VarSome community users and our curation team, who verify the entries.
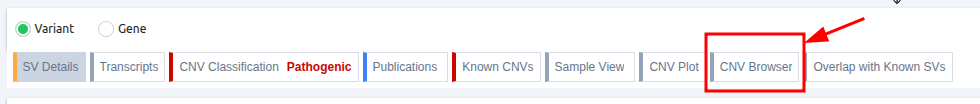
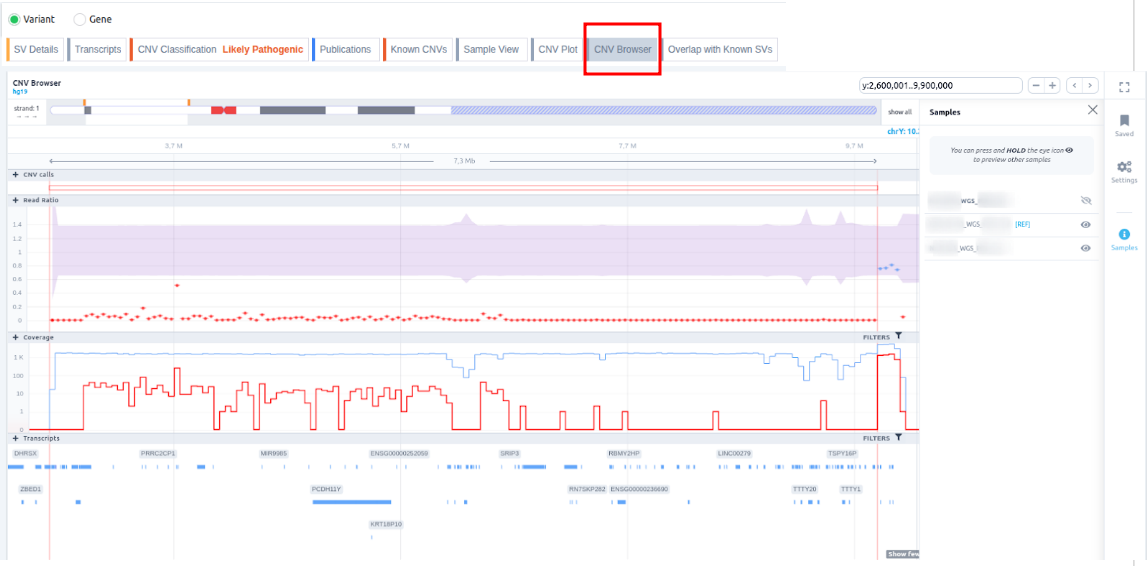
- CNV Browser: an interactive browser showing a wider region around the position of the CNV call as well as its location on the chromosome level. The user can zoom in and out using the mouse scroll and select among different chromosomes, genomic positions, samples, and CNV calls. Data points represent read ratios (observed/expected read counts). These are colored blue if they fall within the 95% confidence interval (shaded purple), and colored red if they fall outside it. The call genomic location is indicated by coordinates and annotated for overlapping gene structures (exons/introns). The coverage track, at the bottom of the interactive plot, shows the trend of the coverage on a logarithmic or linear scale across all cohort samples. Hovering over the browser provides useful CNV call information, including genomic location and span, as well as links to the same region in other analyses of the same cohort. You can find further information regarding CNV visualization.


- CNV plot: We provide a CNV plot, showing how the observed read depth in the area of the CNV differs from the expected. The CNV plots are generated using a modified version of the ExomeDepth tool. You can find further information regarding CNV visualization.
- Overlap with known SVs: provides detailed information about the known CNV overlap shown in the column, as well as all other known CNVs that overlap with the user’s CNV at lower percentages. In addition, the card lists all overlapping genes for each known CNV overlap, allowing users to directly review gene-related clinical information in VarSome. More information can be found in the document Overlap with known SV.
- Known CNVs: We display only the relevant CNVs for the classification according to the following criteria:
-
- CNV deletions: We retain those that fully overlap with the given CNV for gnomAD variants. For CNVs coming from clinical sources (Decipher, DBVar, ClinVar CNVs) we use the overlapping CNVs if they are benign and the contained CNVs if they are pathogenic.
- CNV duplications: we keep only the CNVs encompassing the same coding genes. If the CNV is non-coding, then we retain the CNVs that have at least 85% of overlap.


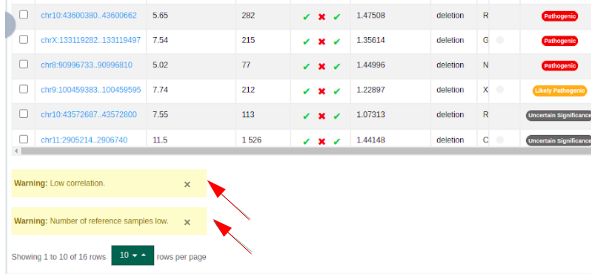
Warnings are displayed under the variant table to inform the user of the reliability of CNV calls of the sample if:
-
the correlation of the sample to its reference samples is low, and
-
the number of reference samples is low.
Searching through CNV results
As you inspect the CNV results of your sample, you can search for a known, or previously detected from the main analysis of the sample, SNV, or small INDEL, and see if it overlaps with any detected CNV.
Reads alignment visualization for CNVs
You can view the alignment of the reads in the regions of the detected CNVs on JBrowse.

Once you have selected a variant on the Variant Table, you can see the alignment of the reads by clicking on the JBrowse icon on the top left of the screen. The CNV call region is highlighted in yellow.

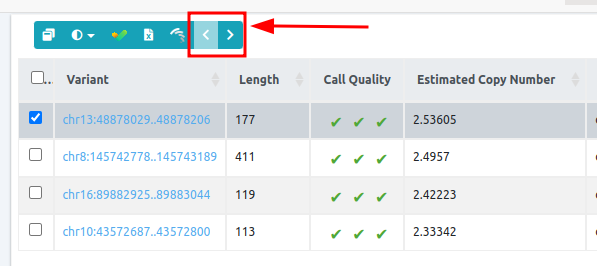
Browsing through the samples of a CNV analysis
You can browse through the samples analyzed under the same CNV/SV analysis by visiting the results page for a sample. Using the red arrows, you can be directed to the next or previous sample:
You also have the option to download your filtered SV results, as it has been possible for SNP/small INDEL analyses, from the upper right corner of the Variant Table: