You can view a quality control report about your analysis and download it as a PDF file or export it as a docx file. The report includes a list of information such as sequence technology, read alignment results, regions reported, coverage, number of identified variants by class, summary for ACMG rules and number of SNV found in coding regions.
In order to find the Quality Control (QC) Report of an analysis in VarSome Clinical you can go either:
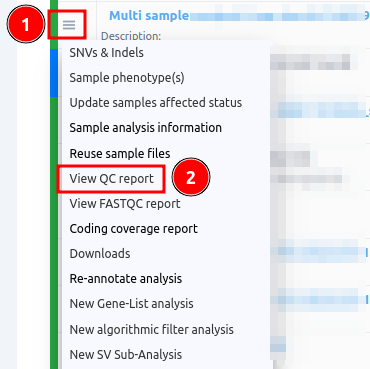
- to the Analyses page and select from the three horizontal lines next to the analysis name you wish the "View QC Report" or
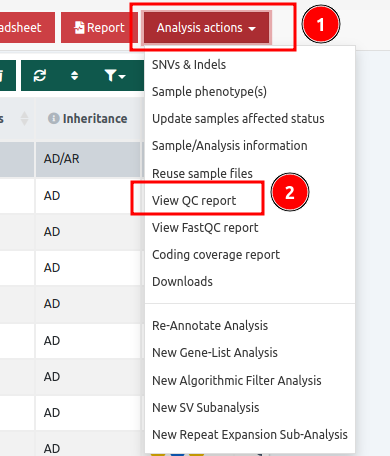
- in the Variant Table page you can click on the "Analysis actions" button and select the same option
A QC report includes all of the categories presented below:
General information
Simple information about the user, the reference genome, the sequencing technology, the file name and the type of pipeline used.
Software and Database versions
Information about Saphetor's and Sentieon's software versions used for alignment and variant calling and all available sources' versions that were used in the pipeline for annotation.
Read alignment results
This matrix reports information about the alignment of all reads and on the targeted regions of the selected assay.

Regions reported and Average region coverage
Display of information regarding the assay used for the analysis and the average coverage of the targeted regions.

Coverage
This matrix shows the coverage depths and percentages of all positions in total and of the targeted regions

Variant type summary

Number of identified variants by ACMG class
The matrix presents the number of automatically classified variants in each of the 5 standard pathogenicity classes.

Summary for ACMG Rules
Display of the number of times (and its percentage) each Germline Variant Classification rule was triggered.

Variants found in coding regions and targeted regions
These matrices show the number of variants found per variant type and external data source (ClinVar, dbSNP and gnomAD) in coding regions and targeted regions respectively.

Software and Database versions
Information about Saphetor's and Sentieon's software versions used for the alignment and variant calling and all available sources' versions that were used in the pipeline for annotation.
Quality Control report for CNV analyses
We highly recommend users check the CNV QC report first. This report provides useful information on how the reference set of samples was generated for each of the samples of the cohort. You can find more information in the document CNV Quality Control: tools and guidelines. The CNV QC report also checks that the median coverage of each sample was sufficient. Each input sample is compared against an optimized set of reference samples chosen from among the other samples of the cohort. The set of reference samples is automatically generated by the algorithm for each sample of the cohort (test sample).
Please bear in mind that the reference set of samples might not include all the other samples of the cohort. The reference set is chosen based on how well the coverage correlates with that of the test sample. The algorithm will choose the largest set of samples from the reference with the greatest correlation coefficient.
A sample will not be included in the reference set if it results in a decrease of the correlation coefficient.
In the CNV QC report, the user can check how many samples were used to construct the reference set for each test sample and their correlation coefficient. A high number of samples (at least 2) used for the reference set and a high correlation coefficient (> 0.97 for gene panels and > 0.98 for exomes) would be indicative of a good performance and a higher reliability of the CNVs found in that test sample. If the coefficient of correlation is too low for a test sample, the algorithm won’t be able to generate meaningful results, and no CNVs will be called in that test sample.
Calling CNVs on the sex chromosomes can create issues if the test sample and the reference samples it is being compared to are not gender matched. To make reliable calls on the X and Y chromosomes, you need to make sure that all samples are of the same sex.
The information from the three different metrics that can be found on the column call quality control can be used in combination with the CNV QC report.
For example, when the second call quality metric (number of reference samples) fails for all variants of the variant table:
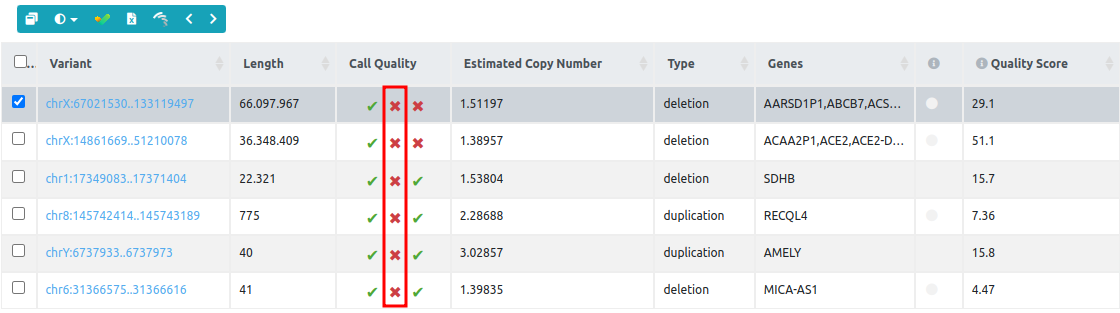
we should go to the QC report and check the size of the reference set. In this example, the reference set used to call CNVs on "Public CNV sample 6" has only one sample and it is therefore below the threshold (2 samples), and this is why the second call quality metric fails for all variants. In this case, we suggest repeating the CNV analyzes with other samples that could be better correlated with the test sample.
