Description of tools for CNV quality control
CNV QC report
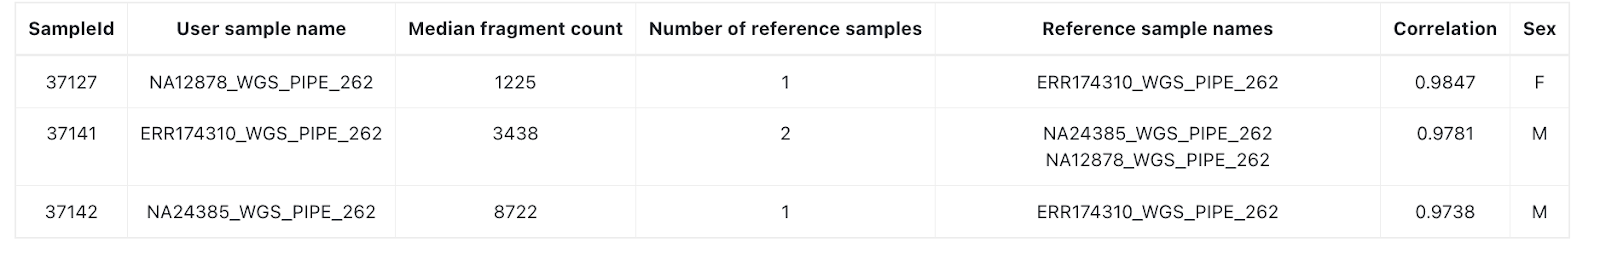
The CNV quality control report is a useful tool to evaluate the performance of a CNV analysis and tο check the correlation between the control samples chosen for each test sample in a given cohort.
It can be accessed from the CNV main analysis as shown above, and provides the following information:
- SampleId: VarSome Clinical unique ID assigned to the sample
- User sample name: the name given by the user for each test sample.
- Median fragment count: It is the median fragment count in each genomic interval of the assay .bed file. These are data generated by exomedepth and used to ensure that a sufficient number of reads is present in each sample. Samples should have a similar range of values (same order of magnitude).
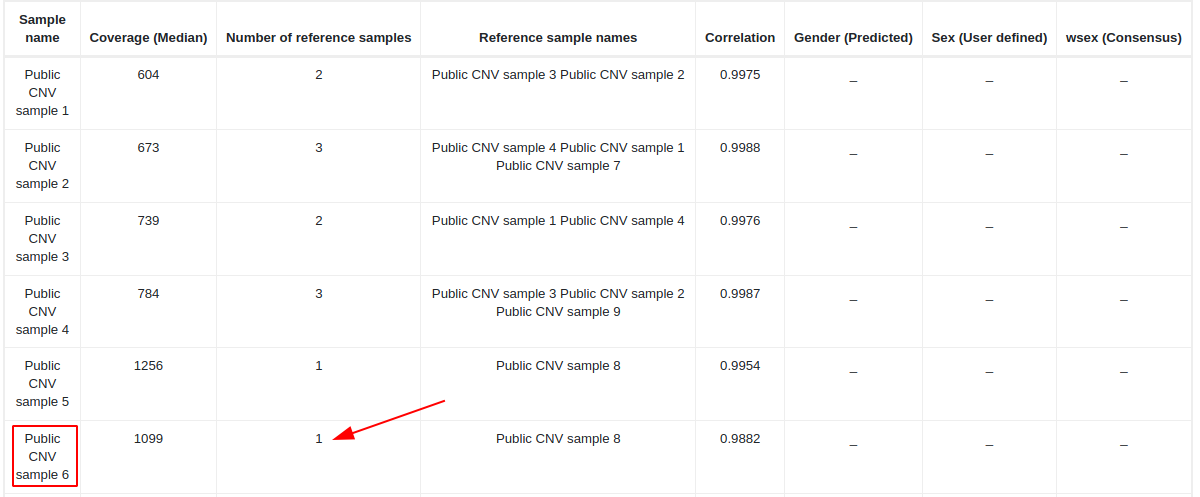
- Number of reference samples: number of reference samples used as controls for this test sample.
- Reference sample names: the names of the samples used as a reference (control) set.
- Correlation: correlation coefficient between the test sample and its reference samples.
- Sex: sex of the samples in the cohort
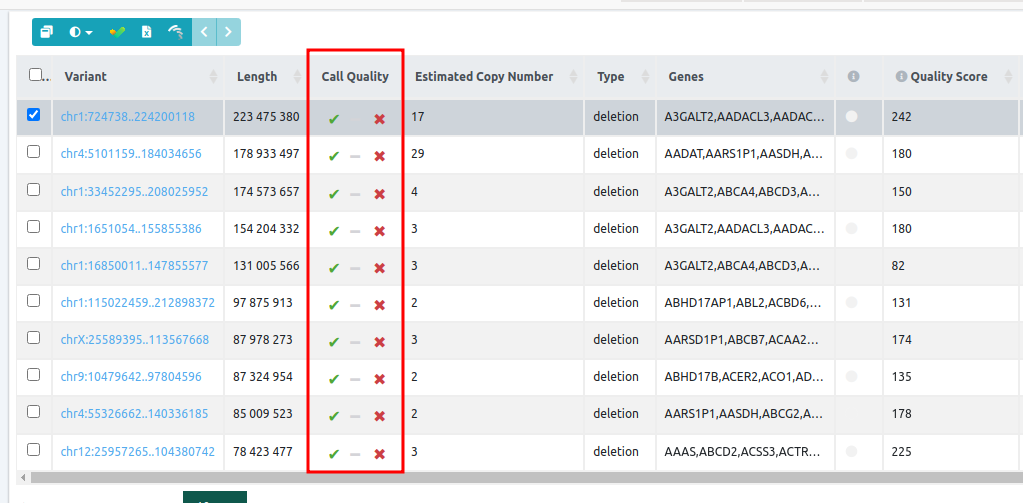
CNV call quality column
Each CNV call is assigned ticks and “X”s, so you can see at a glance whether each CNV has passed or failed the different quality checks. From left to right, these are:
- Test sample coverage: this quality control metric ensures a minimum coverage of the test sample at the CNV call region when calling duplications. Green: duplications with a coverage at least equal or higher than the minimum coverage threshold¹ (please note that all deletions pass this filter and therefore will always have a green color). Red: duplications with a coverage lower than the minimum coverage threshold.
- Number of reference samples: this is to ensure that a minimum number of samples from the reference set have a minimum coverage¹ in the CNV call region. Green: the reference sample set has at least two samples with coverage higher than the minimum coverage threshold, in the CNV region. Red: fewer than two reference samples with sufficient coverage in the CNV call region.
- CNV call overlapping camouflaged region: this is to check whether an overlap exists between the region of the CNV and the Camouflaged Regions (Ebbert et al., 2019). Camouflaged regions contain duplicated genomic sequences where confidently aligning short reads to a unique location is not possible. Green: no overlap. Red: this CNV overlaps with a Camouflaged Region.
¹Minimum coverage threshold (number of reads): the lowest value between 10 or sample median coverage/10.
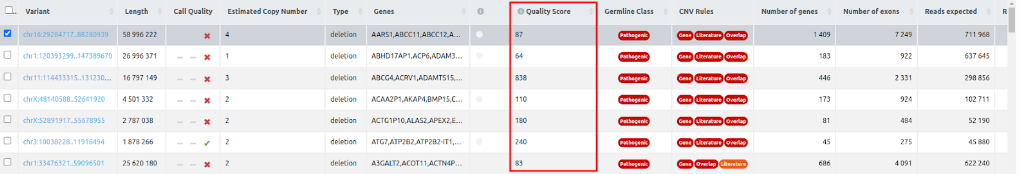
Quality score column
A measure of statistical support for each CNV call. Specifically, it is the log10 of the likelihood ratio of data for the CNV call divided by the null (normal copy number). The higher the Quality Score the more confident one can be about the presence of a CNV. While it is difficult to give an ideal threshold, and for short calls the scores may be unconvincing, the most obvious large calls should be easily flagged by ranking them according to this score.
For WGS CNV analyses, the quality score is given by delly, if it is a single sample, or by ExomeDepth for multiple samples.
For CNVs from VCF, provided for annotation only, the Quality Score displays the QUAL value from the VCF (if included).
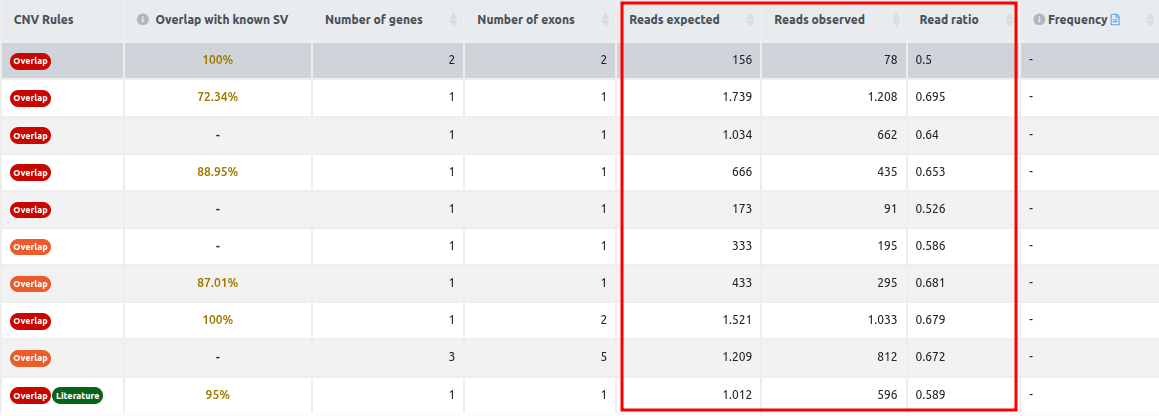
Reads expected, reads observed, and reads ratio
These columns contain the values for each CNV call of the reads expected, the reads observed, and the read ratio. The column read ratio is calculated by dividing the number of observed reads by the number of expected reads. Since the number of expected reads is calculated from the reference set of samples, we highlight the importance of having an appropriate reference set, as we mentioned in the QC report section. Given a good reference set of samples with a good correlation between them, and all three call quality metrics passing the filters, the read ratio value can be used to rank the variants according to the strength of the signal.
CNV visualization
A CNV plot and a CNV browser are available for each call (find more information here).
Guidelines for CNV quality control
1. Check the CNV report: are my samples well correlated?
We highly recommend users check the CNV QC report first. This report provides useful information on how the reference set of samples was generated for each of the samples of the cohort. It also checks that the median coverage of each sample was sufficient.
Each input sample is compared against an optimized set of reference samples chosen from among the other samples of the cohort. The set of reference samples is automatically generated by the algorithm for each sample of the cohort (test sample). Please bear in mind that the reference set of samples might not include all the other samples of the cohort. The reference set is chosen based on how well the coverage correlates with that of the test sample. The algorithm will choose the largest set of samples from the reference with the greatest correlation coefficient. A sample will not be included in the reference set if it results in a decrease of the correlation coefficient.
In the CNV QC report, the user can check how many samples were used to construct the reference set for each test sample and their correlation coefficient. A high number of samples (at least 2) used for the reference set and a high correlation coefficient (> 0.97 for gene panels and > 0.99 for exomes) would be indicative of a good performance and a higher reliability of the CNVs found in that test sample. If the coefficient of correlation is too low for a test sample, the algorithm won’t be able to generate meaningful results, and no CNVs will be called in that test sample.
Calling CNVs on the sex chromosomes can create issues if the test sample and the reference samples it is being compared to are not gender matched. To make reliable calls on the X and Y chromosomes, you need to make sure that all samples are of the same sex.
2. Call quality column
This column is composed of three different metrics, and will provide information about the quality of each particular CNV variant called. This information can be used in combination with the CNV QC report.
For example, when the second call quality metric (number of reference samples) fails for all variants of the variant table:
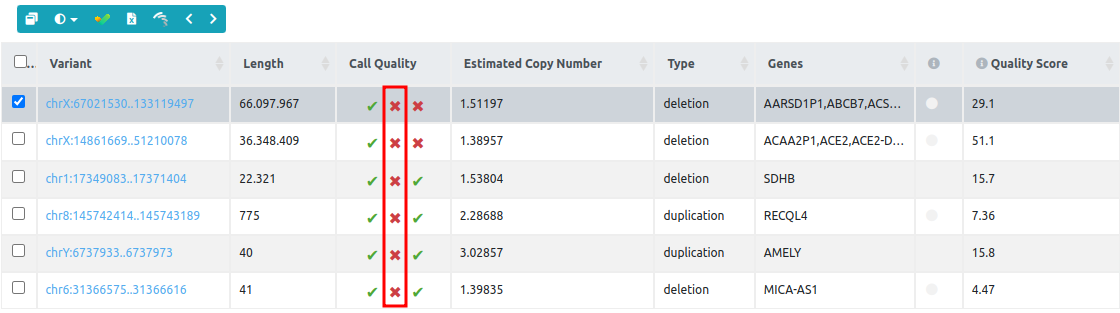
We should go to the QC report and check the size of the reference set. In this example, the reference set used to call CNVs on "Public CNV sample 6" has only one sample and it is therefore below the threshold (2 samples), and this is why the second call quality metric fails for all variants. In this case, we suggest repeating the CNV analyses with other samples that could be better correlated with the test sample.
3. Quality score column
The quality score quantifies the statistical support for each CNV. It is the log10 of the likelihood ratio of data for the CNV call divided by the null (normal copy number). The higher that number, the higher the confidence about the presence of a CNV. We cannot provide an ideal quality score threshold to discard CNV variants since it is highly dependent on each cohort and on the length of the CNV (small CNVs will always have lower scores). The most obvious large calls, however, can be easily flagged by ranking them according to this score.
4. Read ratio column
This column is calculated by dividing the number of observed reads by the number of expected reads. Since the number of expected reads is calculated from the reference set of samples, we highlight the importance of having an appropriate reference set, as we mentioned in the QC report section. Given a good reference set of samples with a good correlation between them, and all three call quality metrics passing the filters, the read ratio value can be used to rank the variants according to the strength of the signal.
5. CNV visualization
CNV visualization tools (CNV plot and browser) can be used in combination with the previous features described to evaluate the reliability of the found CNVs.
For example, you can use the CNV browser to visualize and contrast the test sample coverage of the region of the CNV call to other samples of the cohort. Genuine CNV calls usually show a clear, distinct pattern of coverage in the test sample that is not replicated in the reference samples.
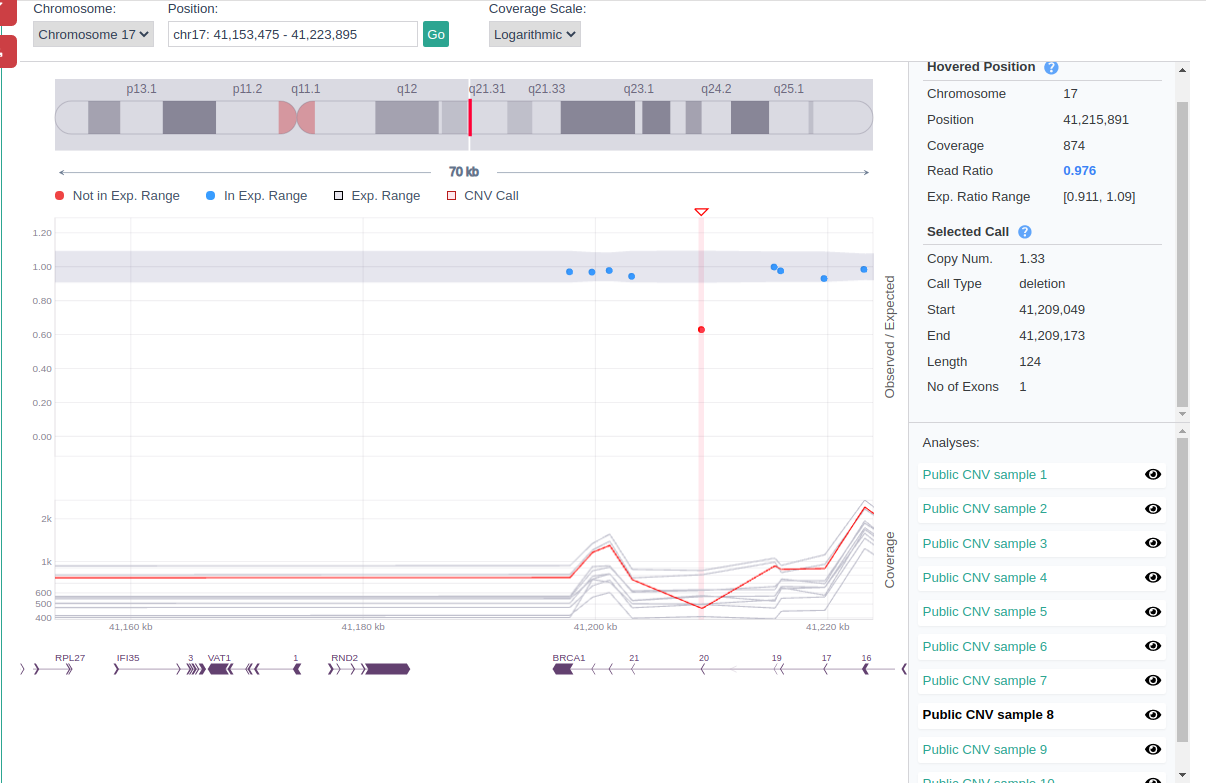
More information about the CNV visualization can be found in the document CNV visualization.