Browsers
VarSome Clinical offers different browsers to visualize the data. These are the Region Browser, CNV Browser and Sample View Browser. Each browser provides different information.
-
The Region Browser displays the variant in the context of its genomic "neighborhood", including transcripts and other, nearby variants and their pathogenicity as well as frequencies from GnomAD.
-
The CNV Browser provides an interactive graph to visualize the CNV call region in all samples of the cohort.
-
Finally, the Sample View presents a genome region browser, but one that is focused on displaying the variants (SNPs, indels, CNVs) identified in the current sample. This provides a global overview of the variants identified in the current sample.
⚠️ Please note that the genome browsers on VarSome utilize 3D computer graphics. To access these features, you may need to enable hardware acceleration in your browser. If that does not work, you might need to adjust the 3D APIs policy in your browser settings by setting Disable3DAPIs to FALSE.
Browser interface settings
There are four icons on the right hand side which can be used to maximize the browser, save the current position on the browser to use in any of the 3 browsers, and change various display settings as shown in the image below. The reset button will bring the browser back to the original position in case the browser has been moved.
- General settings:
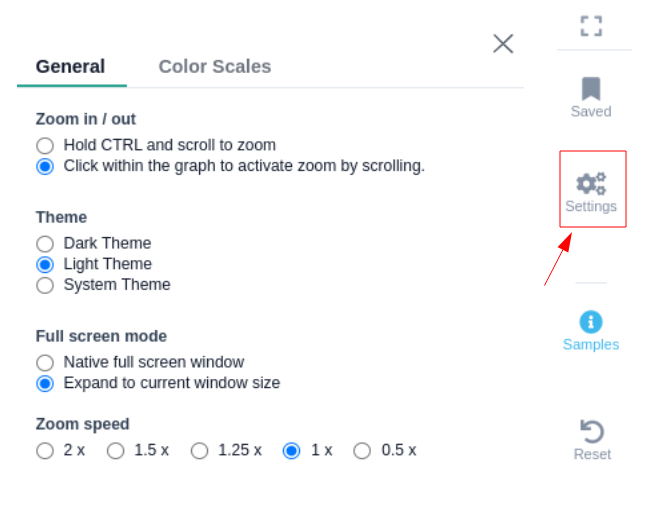
- Theme: You can select the theme of the genome browser component. Note that by selecting the system theme, the theme is adjusted to the one you have selected from the setting background option on your browser.
- Gesture control options:
- Hold ctrl and scroll to zoom : Use CTRL + SCROLL to zoom in/out
- Click to activate scroll zoom : Use SCROLL to zoom in/out
- Full screen mode: You have the option to select the size of the genome browser window.
- Native full screen window
- Expand to current window size
- Zoom speed: The option to adjust the speed while zooming in/out inside the genome browser window (default = 1x).
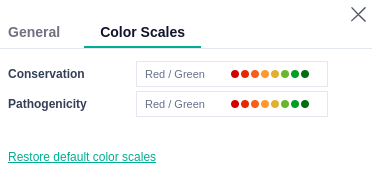
- Color scales: You can choose the colors/color scales for every track in the different browsers, e.g. Conservation and Pathogenicity on the genome region browser and sample view. Click on the drop-down menu of the track that you want to change, and select one of the predefined palette options.
Genome Browser color scales:

CNV Browser color scales:

Sample View color scales:
Search for a position or a gene
You can use the search box on the top right of the browser to search for a position in the genome (e.g. chr1) or for a specific gene (e.g. BRCA1). To search for a gene, you need to delete the genomic location displayed and type in the name of your gene of interest.
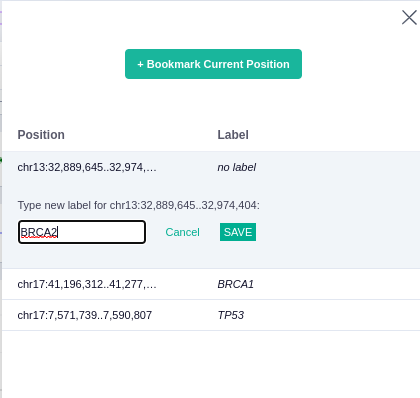
The saved icon on the right can be used to bookmark the current position, providing a label that can be used later.
Chromosome track
In the chromosome track, the user can switch strands by clicking on the "STRAND" button. STRAND 1 (default) refers to the positive strand (5'-3' direction), while STRAND -1 to the negative one (3'-5' direction). Additionally, the browser offers the option to expand the chromosome-level visualization from the current chromosome to all chromosomes (and vice versa), by clicking on the "show all" button on the right-hand side of the bar. Each chromosome can be selected for visualization to inspect the identified variants.


Zoom in and out area
It is possible to zoom in and out on the different tracks of the browser. If the area is marked with a green rectangle this means the focus is on that area and it is possible to use the mouse scroll to zoom in and out. Otherwise no green rectangle is displayed and there is a need to use Ctrl + scroll to zoom in and out.
Green rectangle
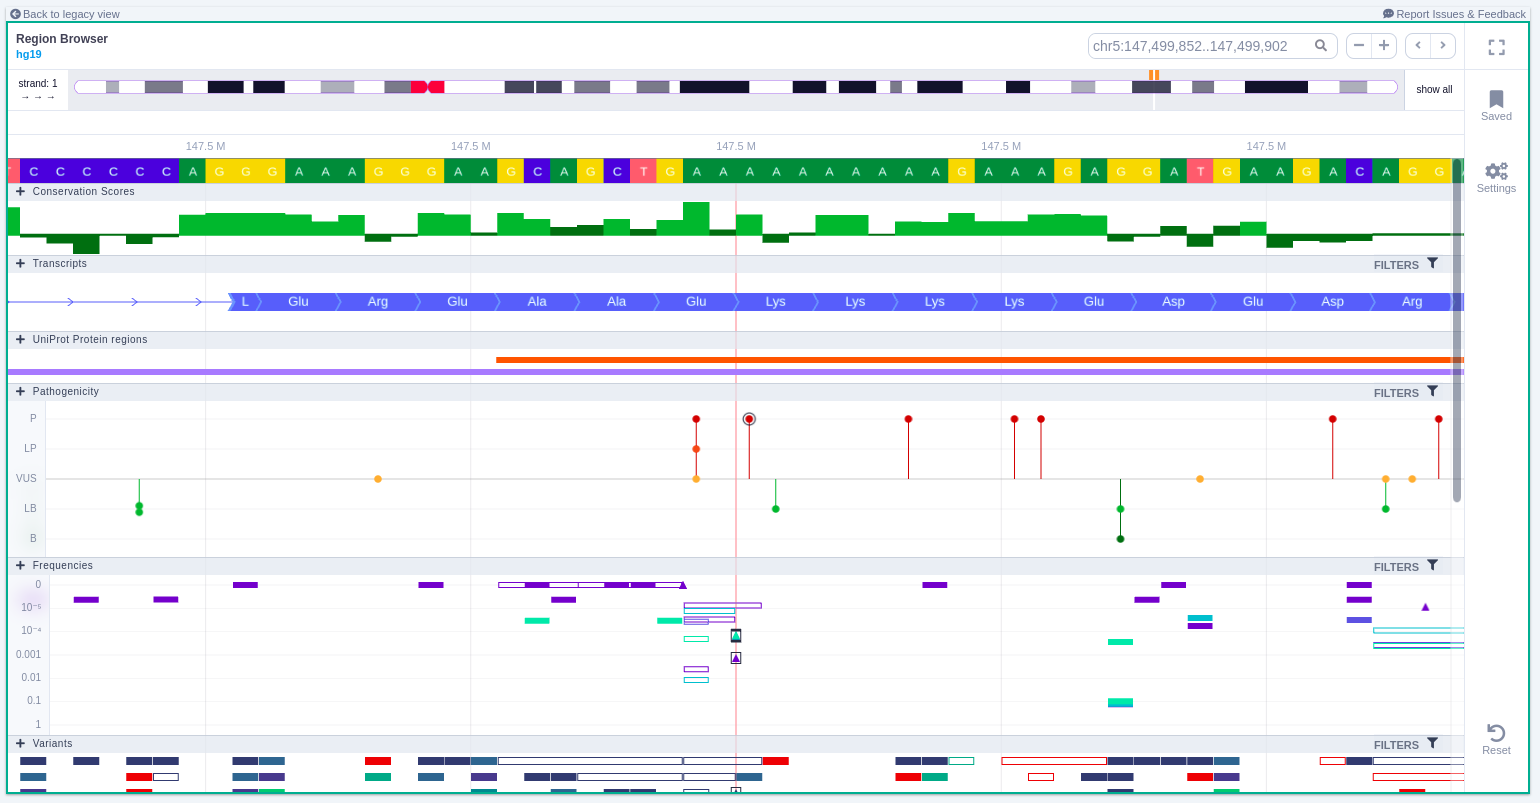
Without green rectangle

CNV Visualizations
CNV Browser
The CNV Browser can be found under the variant table. It provides an interactive graph to visualize the CNV call region in all samples of the cohort.
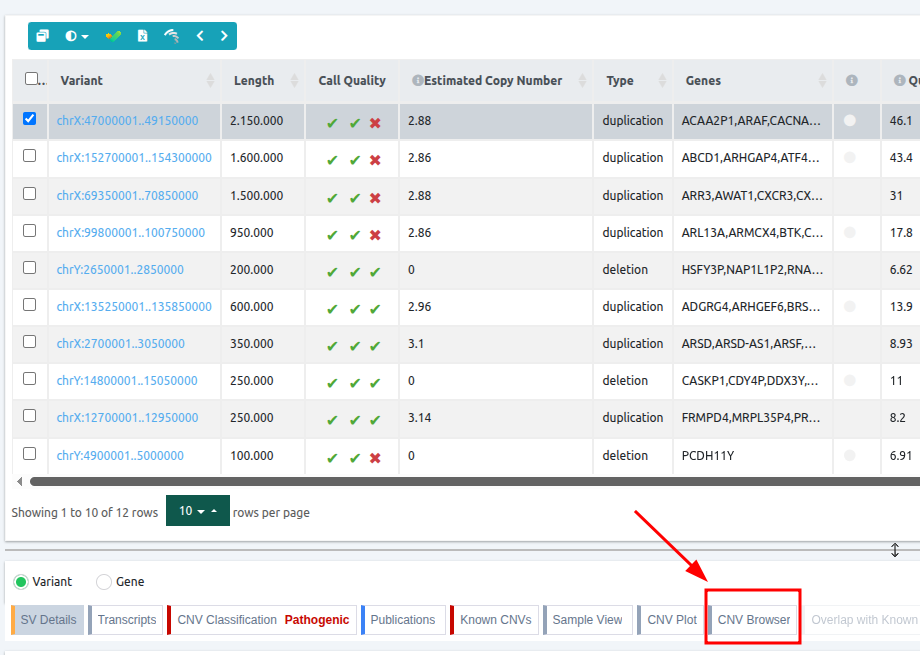
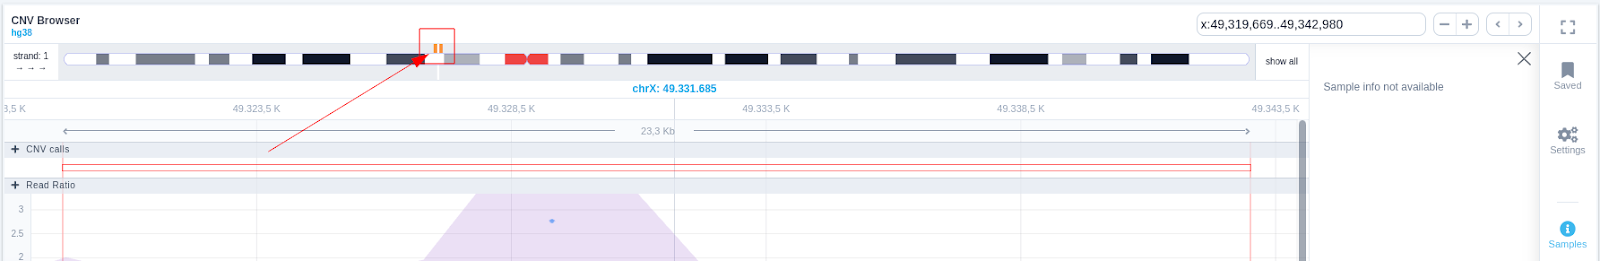
The position of the CNV call in the reference genome is marked at the top of the CNV Browser and the chromosome name is shown on the left. The user can change the size of the region shown by dragging:
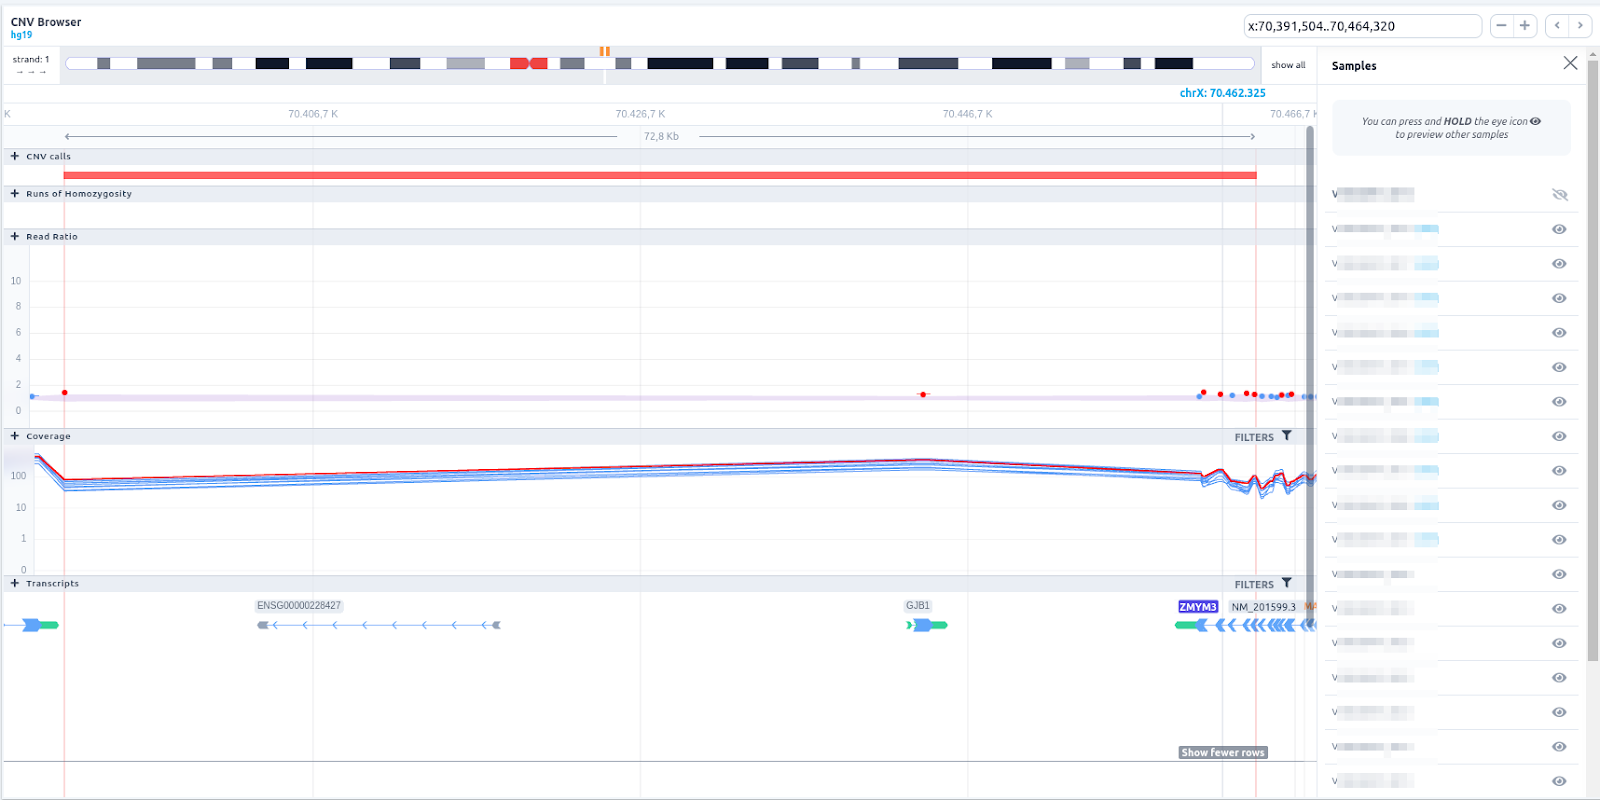
In the chromosome track the user can choose which strand they want to see with all the related data, by clicking on the "STRAND" button. STRAND 1 (default) refers to the positive strand (5'-3' direction), while STRAND -1 to the negative one (3'-5' direction). Additionally, the browser offers the option to expand the chromosome-level visualization from the current chromosome to all chromosomes (and vice versa), by clicking on the “show all” button on the right-hand side of the bar. Each chromosome can be selected for visualization to inspect the identified variants.
The CNV calls track shows if it is a deletion or a duplication. Deletions are represented by an empty rectangle and duplications by a full one. The position in the reference genome and the length of the CNV are shown when the user hovers over the browser with the mouse on the rectangle.
Deletion
Duplication
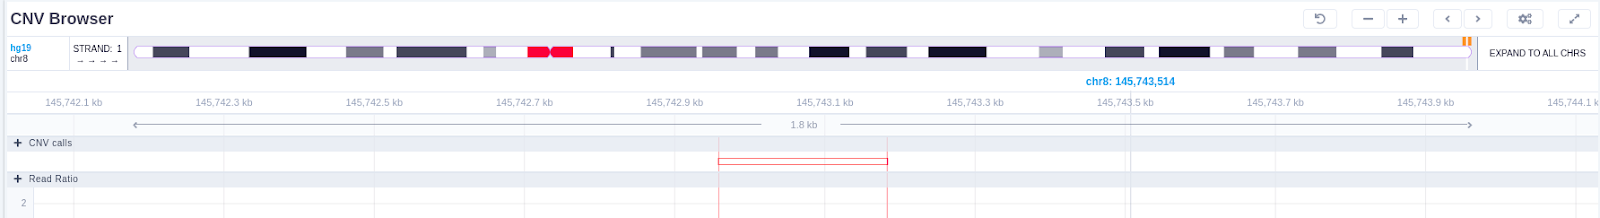
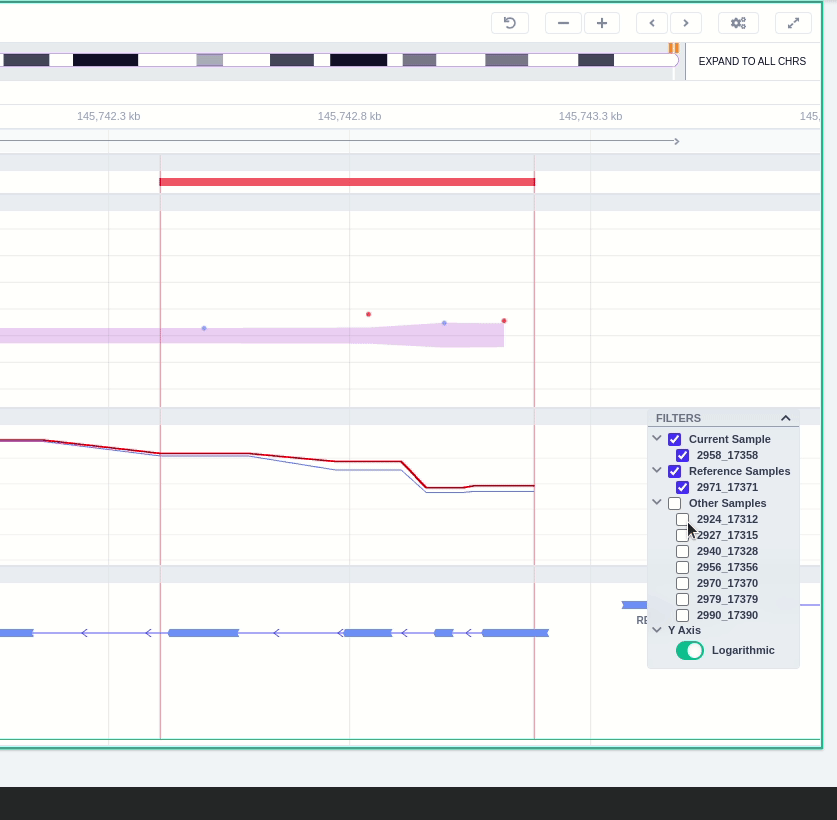
The region of the CNV call is highlighted in orange. The purple area shows the 95% confidence interval of the read ratio (observed/expected reads). Each colored rectangle represents one of the target regions of the assay used to sequence the sample, and its position on the vertical axis indicates the read ratio for this region. Target regions whose read ratio falls within the confidence interval will be colored blue while those whose ratio falls outside the expected range will be red. The observed and expected read ratio is shown when the user hovers the mouse over the target region.


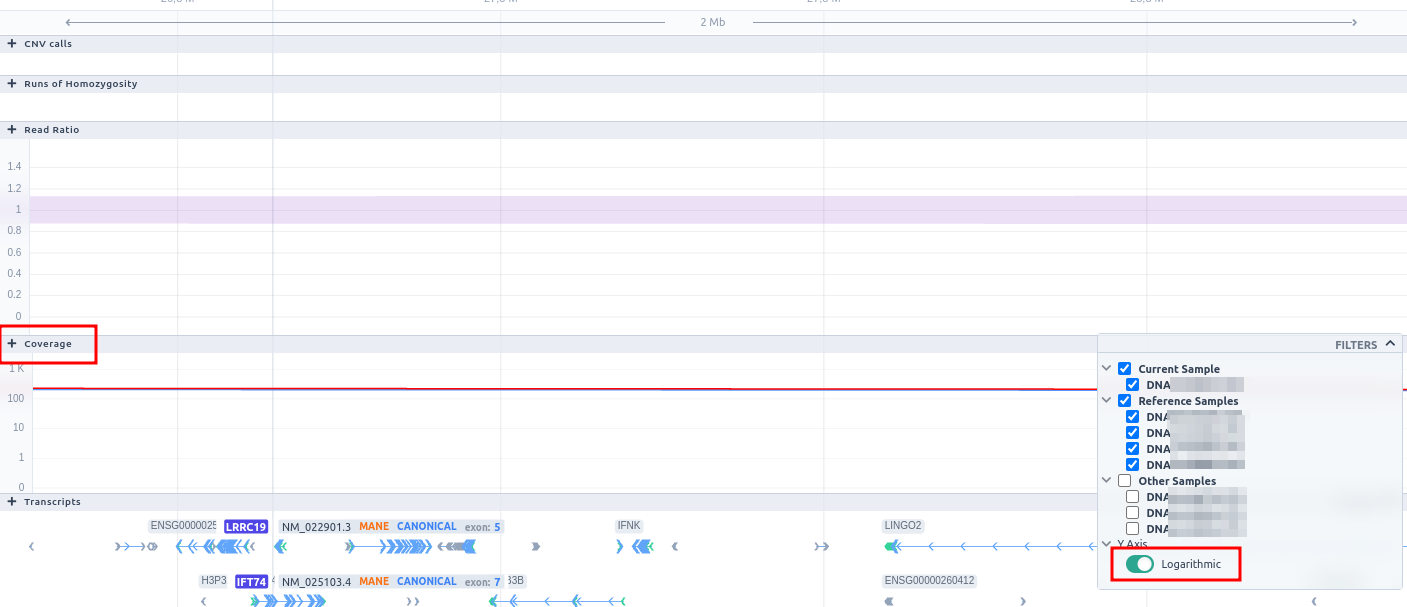
Below the read ratio is the coverage track which shows the depth of coverage across both the test sample (the sample currently under analysis) and the control samples used in this analysis. The test sample's coverage is shown in red and the others are in blue. The user can choose to view the coverage on a logarithmic or linear scale under the Filters panel.
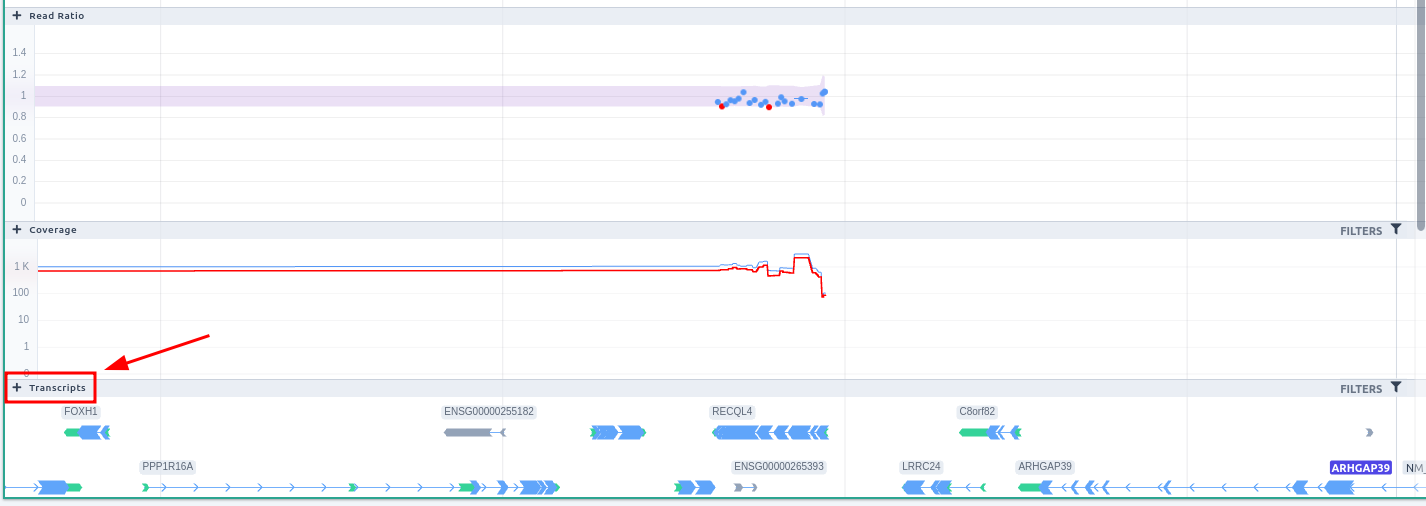
The user can hover along the CNV and see the Coverage for the selected sample, the transcript and its exons.

Clicking on the Samples icon on the right shows a new window where the user can choose to visualize the coverage of the other samples of the cohort by clicking and holding on the eye icon.
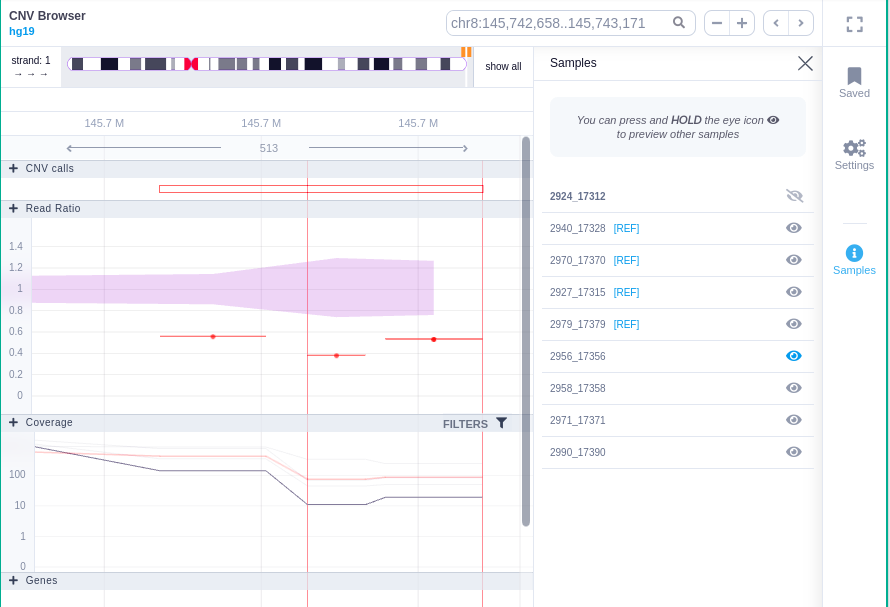
The "FILTERS" panel allows the user to visualize the CNV call region in the rest of the samples of the CNV analysis by checking the box of the sample name. Once checked, hover over the sample names on the filters and only these will be shown in the Coverage track.
Finally, the exonic structure of any genes the CNV overlaps with is shown in the Genes track under the coverage.
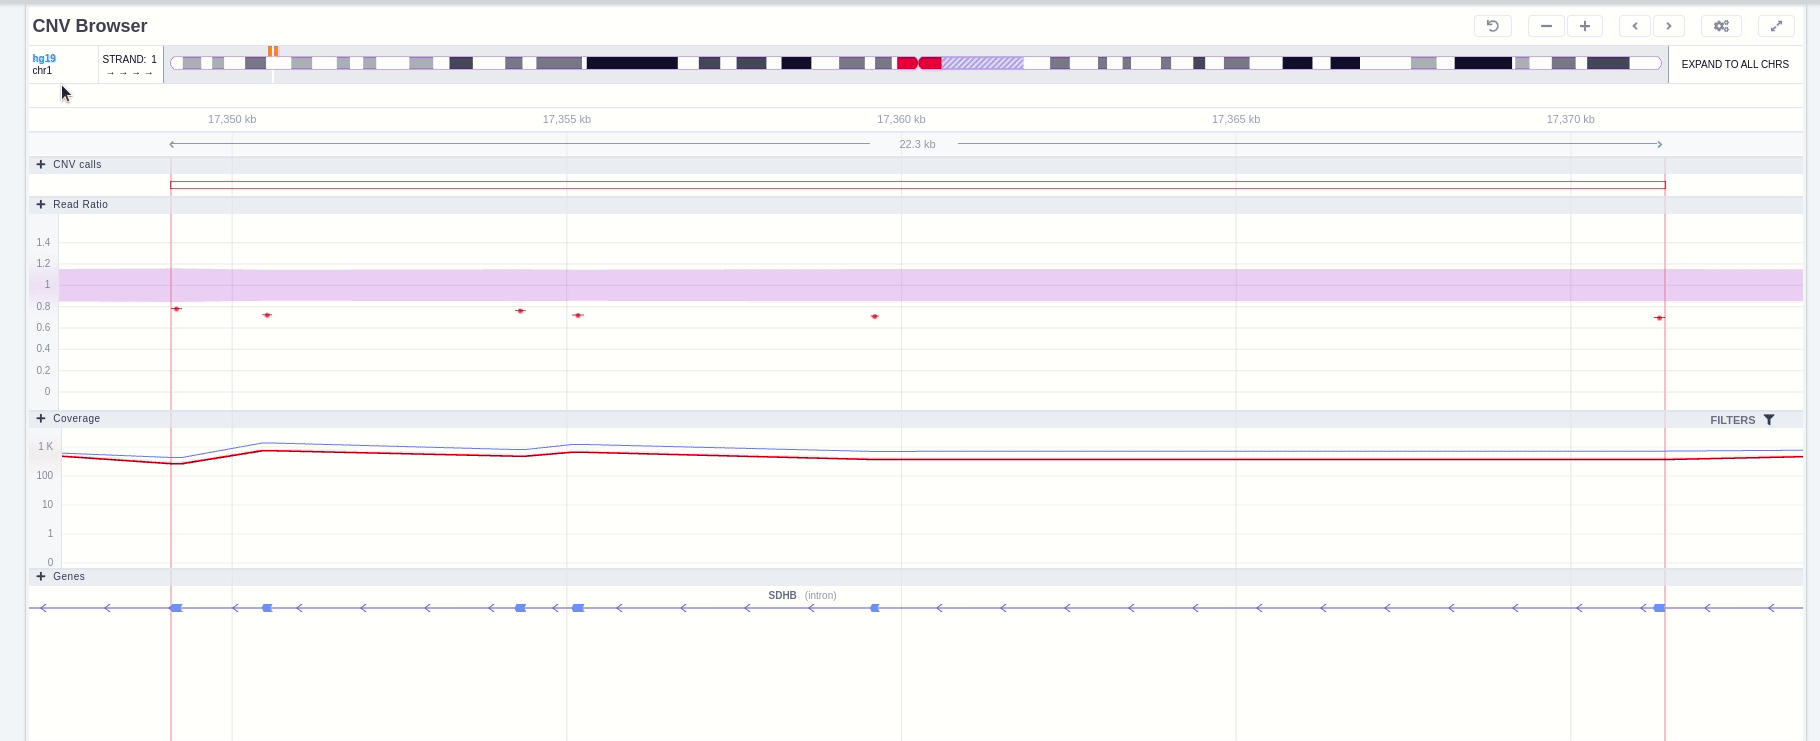
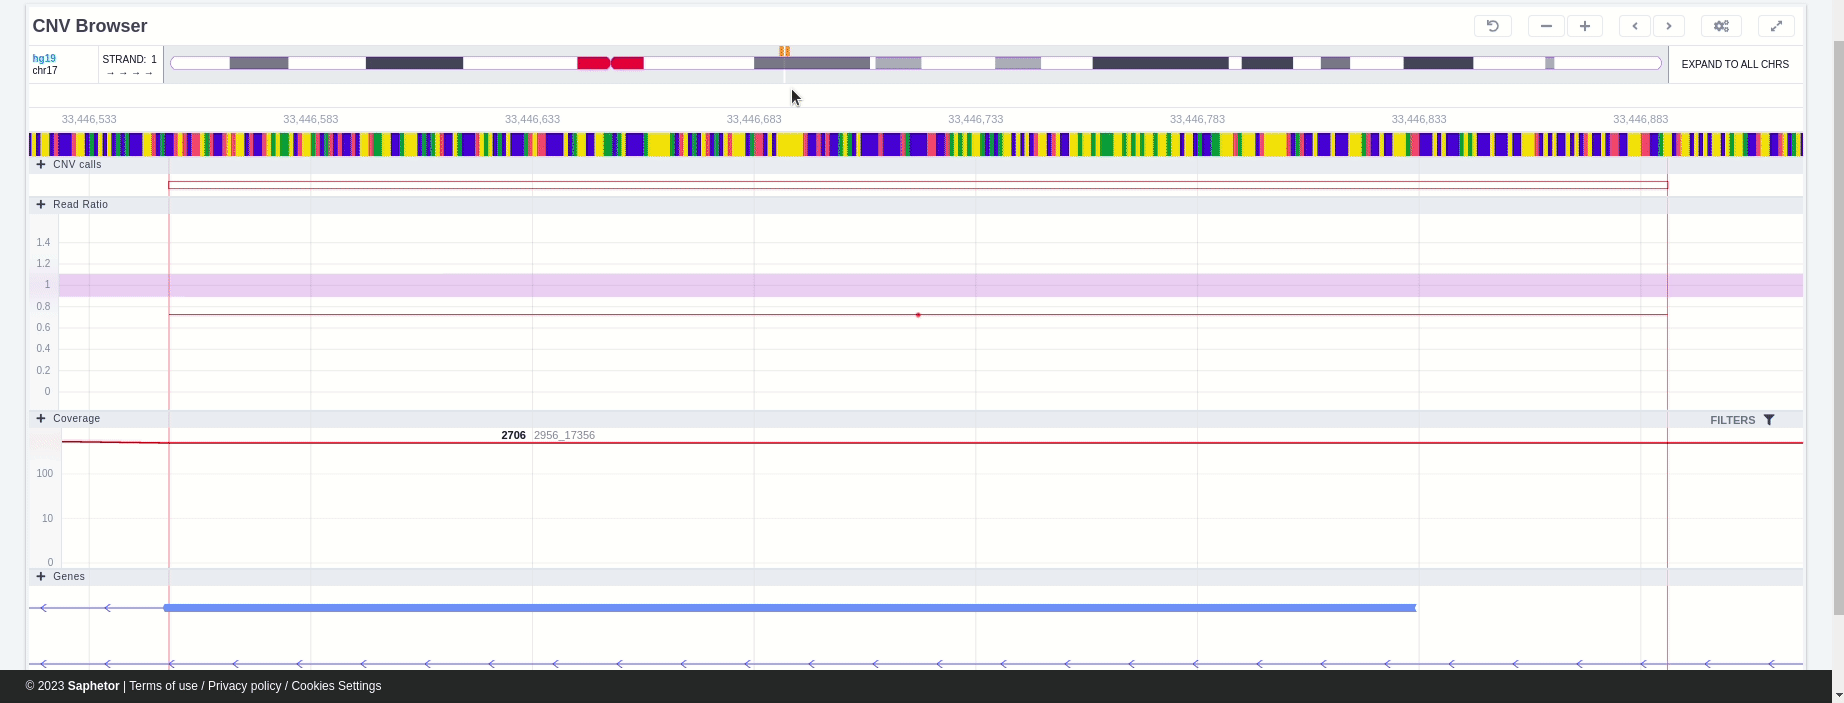
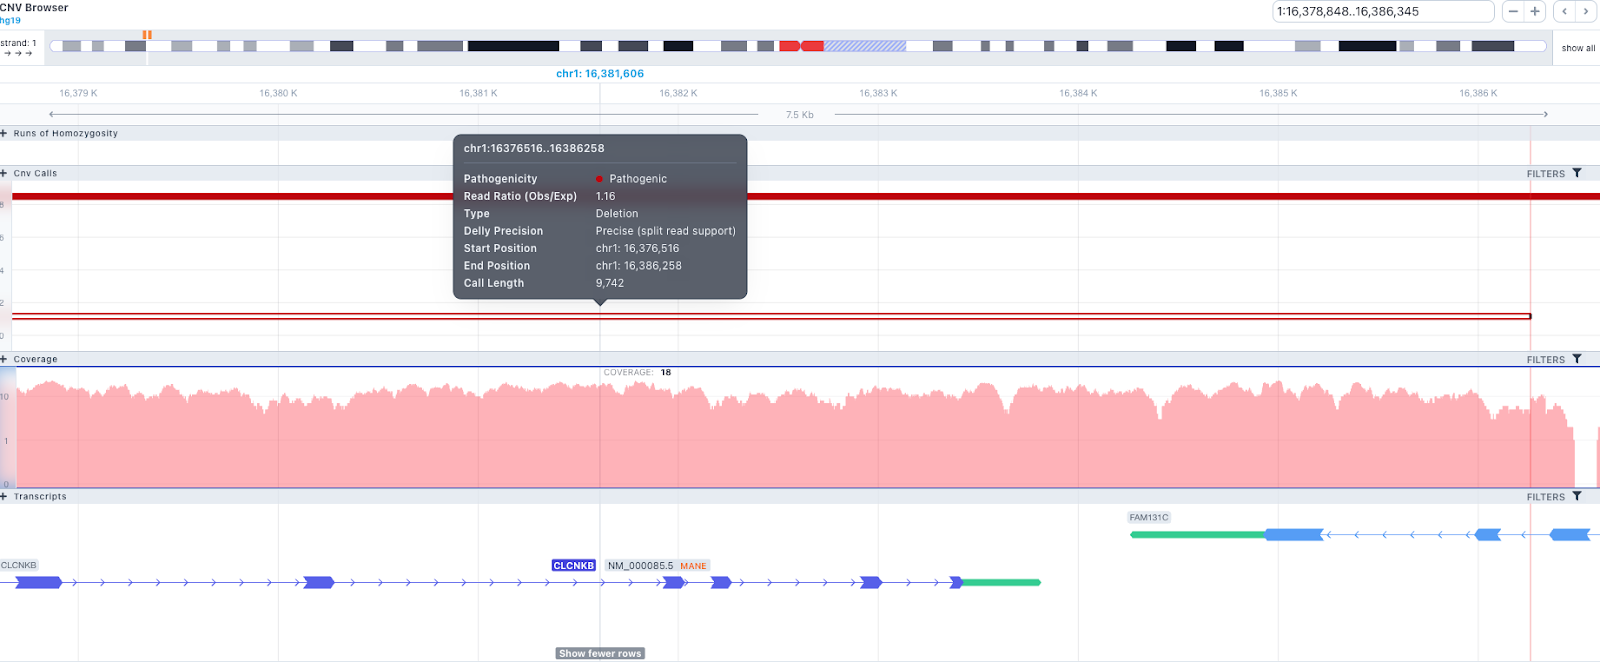
CNV analysis of WGS data (Delly)
This browser shows the CNVs found in the WGS sample. It contains the following tracks:- Runs of homozygosity
- CNV calls: each CNV is colored based on the pathogenicity classification and either filled (insertions) or empty (deletions). Hovering over a CNV, a tooltip is displayed containing information about the pathogenicity, read ratio, type, Delly precision, start/end positions and length. This track can be filtered based on germline classification, zygosity, Delly precision and CNV type. To see the available options, click on the filters button on the top right of the track.
- Coverage: the coverage for the given region is displayed.
- Transcripts: the Transcripts track shows the MANE RefSeq transcript by default. Hover over the transcript to see more details and to load alternative transcripts located in the same region (RefSeq or ENSEMBL).
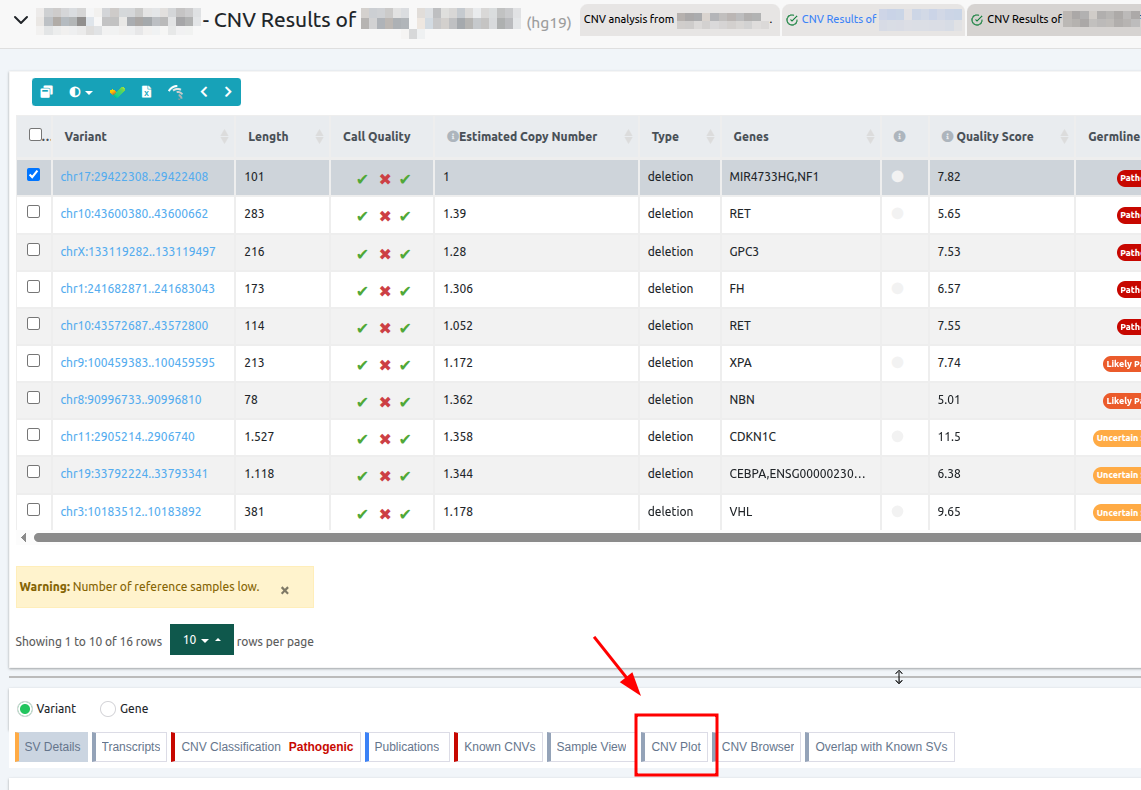
CNV Plot
For CNV cohort analyses, VarSome Clinical provides a CNV plot, showing how the observed read depth in the area of the CNV differs from the expected. The plot can be found on its own tab, under the Variant Table.
The CNV plots are generated using a modified version of the ExomeDepth tool.
- The grey area indicates the 95% confidence interval of the observed/expected read ratio and the red crosses are specific read depth values at those positions. The genomic location of the CNV is given by the vertical dotted lines.
- The left Y-axis shows the "Observed vs expected read ratio" and the right Y-axis represents the "Copy number". The X-axis shows the chromosome coordinates.
- For short CNVs that encompass a few exons, the plot is displayed in a gene-centered view where the exon numbers and their position along the gene are represented in a horizontal axis above the gene name.
- For large CNVs, please note that, since the CNV region might encompass several genes, making it impossible to plot all of them, we only show the position of the canonical transcript for each gene. Therefore, if a gene has no canonical transcript (e.g. annotated pseudogene) or if its canonical transcript doesn't overlap with the CNV, you may see genes listed in the Variant Table that are not shown in the CNV plot since their canonical transcript isn't the one that overlaps with the CNV.
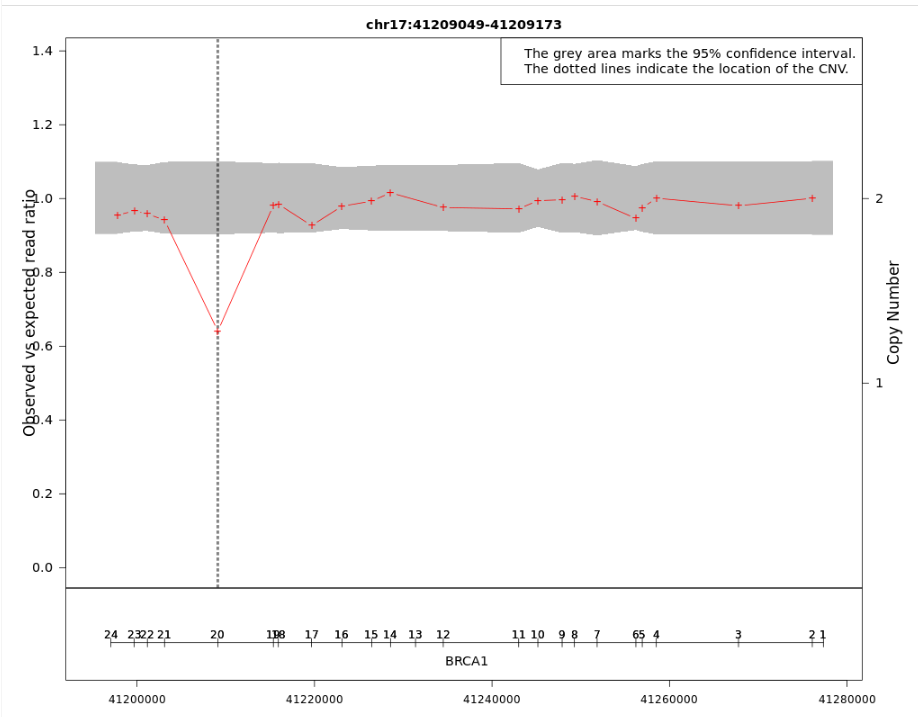
Figure: In this example, the observed to expected read depth ratio in the region of the CNV is lower than 1 and below the 95% confidence interval (grey area). These results support the hypothesis of a deletion in the exon 20 of the BRCA1 gene.
Known CNVs
- CNV deletions: we retain those that fully overlap with the given CNV for gnomAD variants. For CNVs coming from clinical sources (Decipher, DBVar, ClinVar CNVs) we use the overlapping CNVs if they are benign and the contained CNVs if they are pathogenic.
- CNV duplications: we keep only the CNVs encompassing the same coding genes. If the CNV is non-coding, then we retain the CNVs that have at least 85% of overlap.
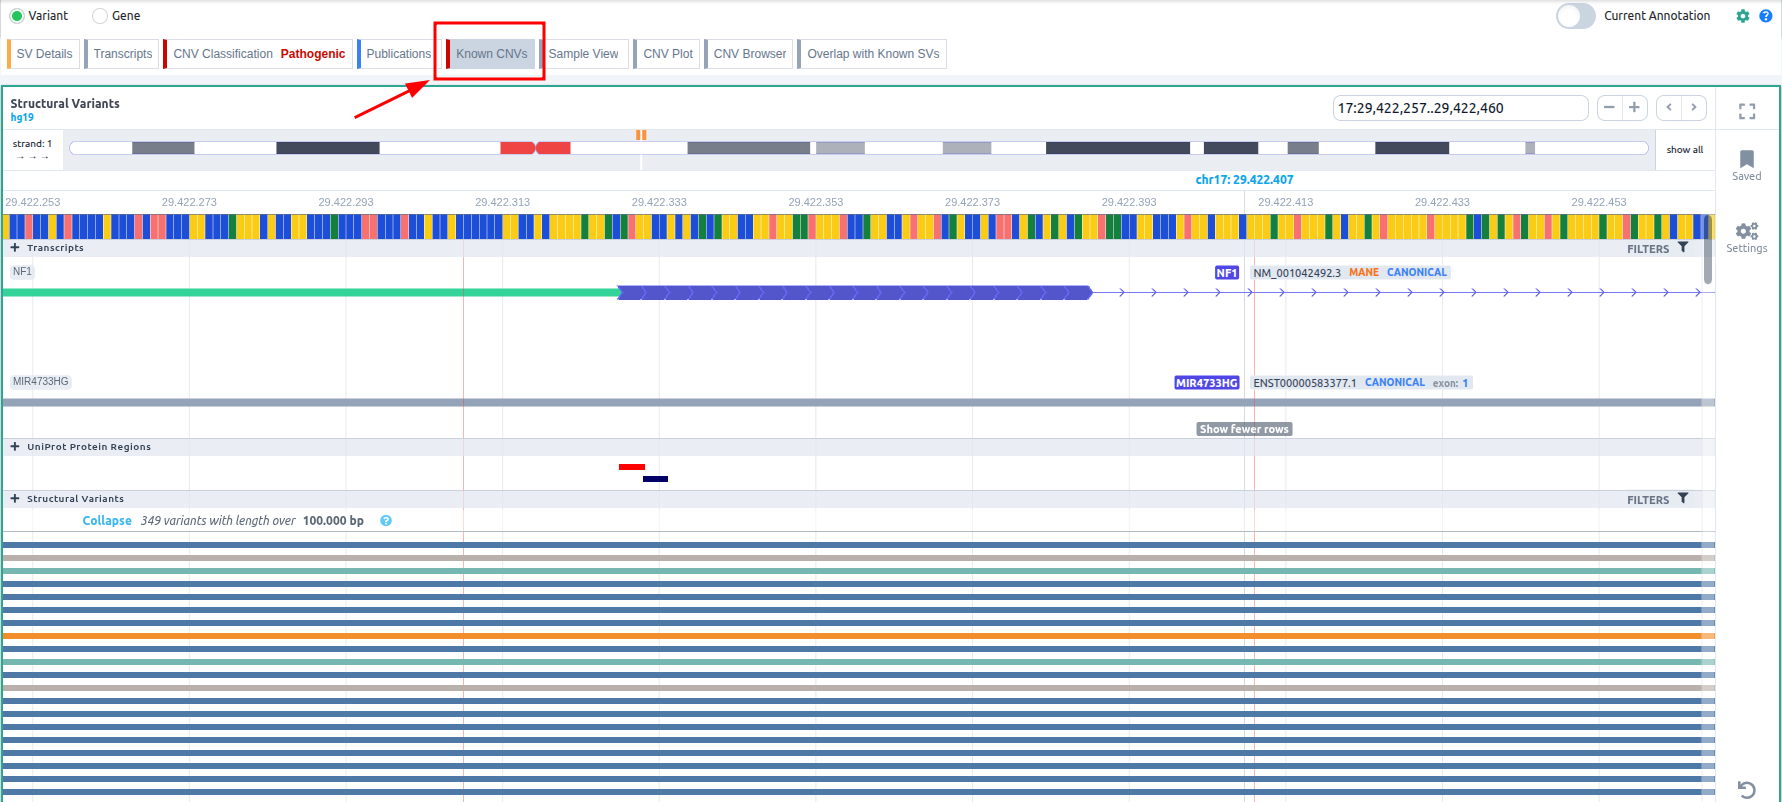

Once you have selected a variant in the variant table, you can click on the JBrowse icon to view the alignment of the reads in the regions of the detected CNVs. The CNV called region is highlighted in yellow. The gene and the transcripts are represented above the aligned reads.
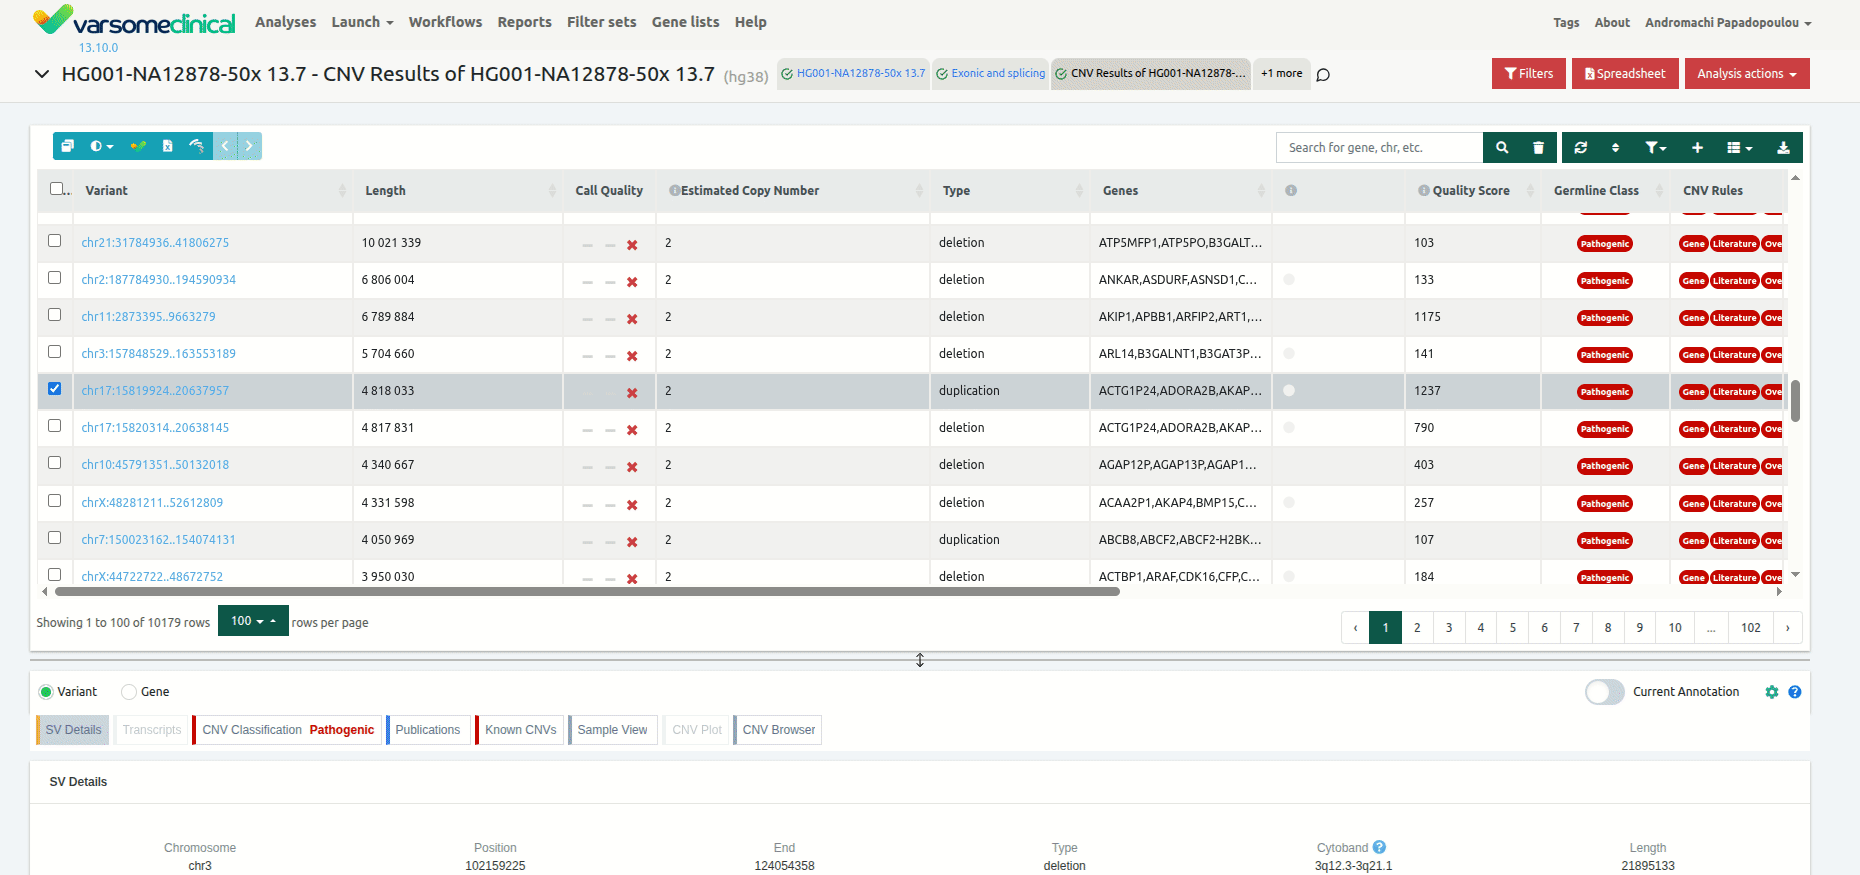
Browsing through the samples of a CNV analysis
You can search through the samples analyzed under the same CNV/SV analysis by visiting the results page of one and using the arrows you can be directed to the next or previous sample: