We have developed our Biomedical Named Entity Recognition tagger which identifies: genes, variants, diseases, phenotypes, chemical compounds, drugs, coding impact, protein impact, functional studies, clinical significance, inheritance mode, organs, tissues, species in abstracts of publications from PubMed.
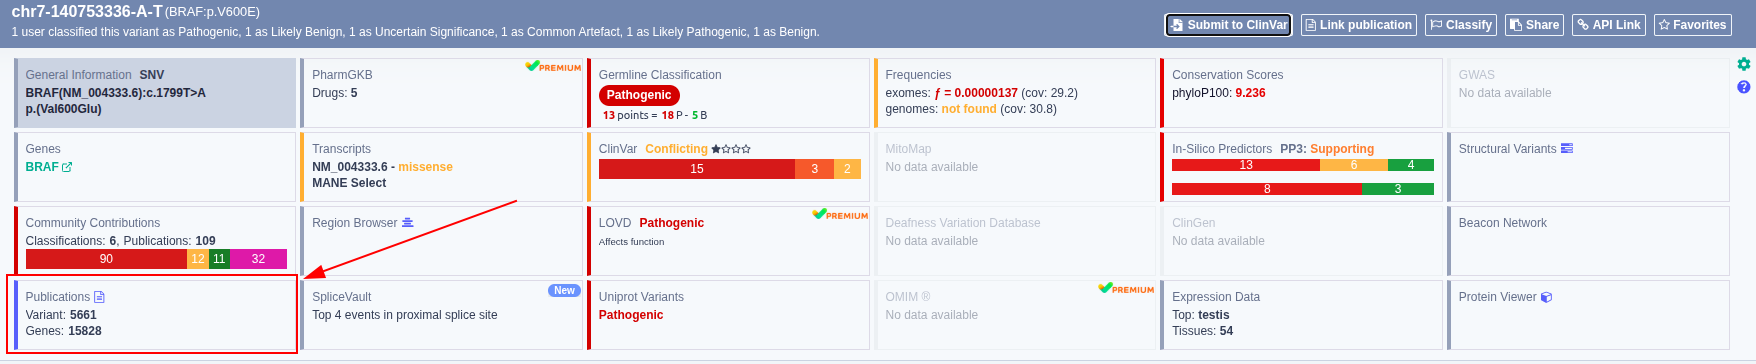
In VarSome we show publications from PubMed related to the variant of interest and its related gene in the "Publications" tab:
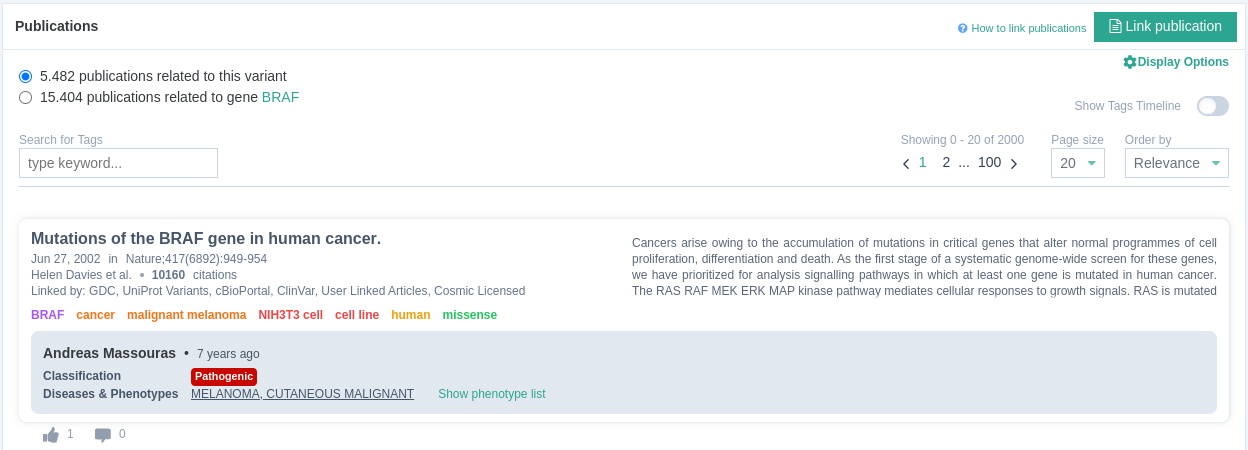
How to use Publications Timeline visualization
This interactive viewer allows you to quickly see the number of publications by year, broken down by gene, disease, variants etc. with the ability to then further drill-down and identify specific publications related to the topic you are researching. It is possible to drill-down into sub-categories of terms, for example to see what diseases are associated with a particular gene.
To use the publications tag timeline select the "Show Tags Timeline" option as shown below:

This opens the Publications Timeline feature.
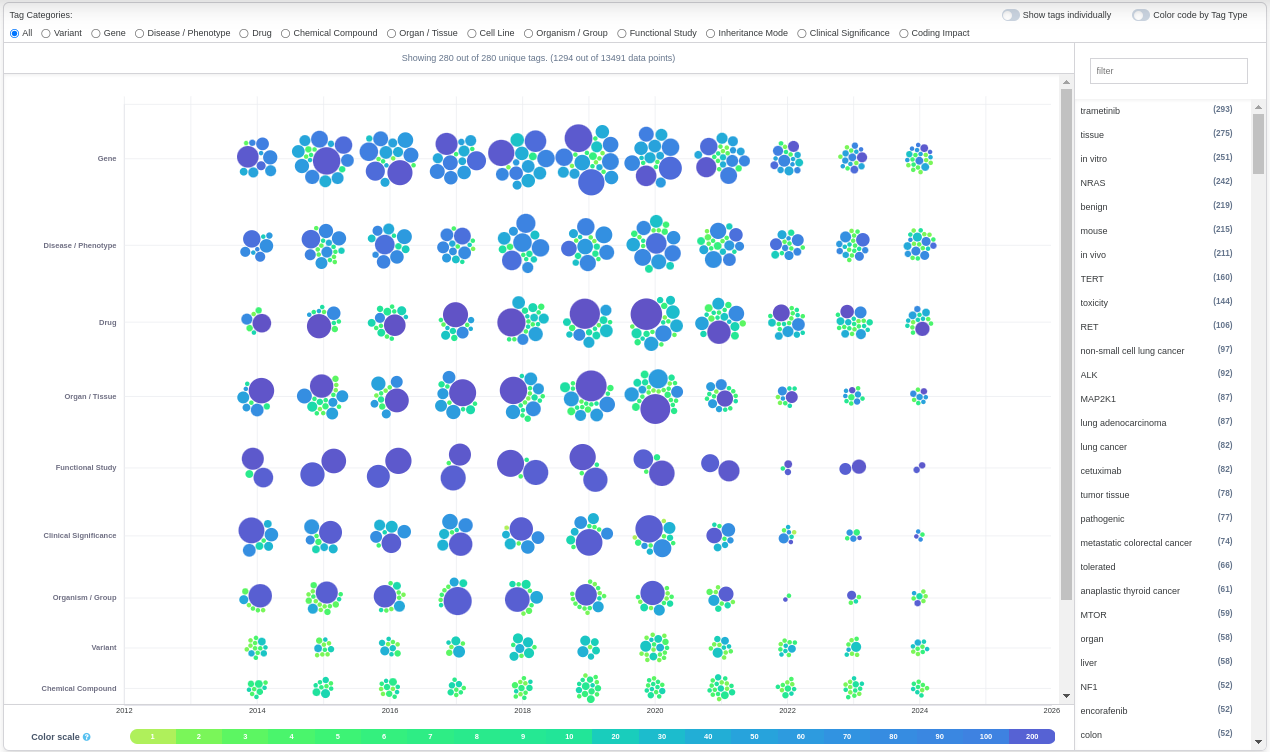
On the top bar there are a number of tools you can use to amend the data presentation of the viewer.
![]()
The viewer defaults to showing "All" tags. It is possible to select only required tag categories by selecting the relevant tag radio buttons.
You can also select to "Show tags individually". In this way you can clearly visualize the number of publications associated with each tag.
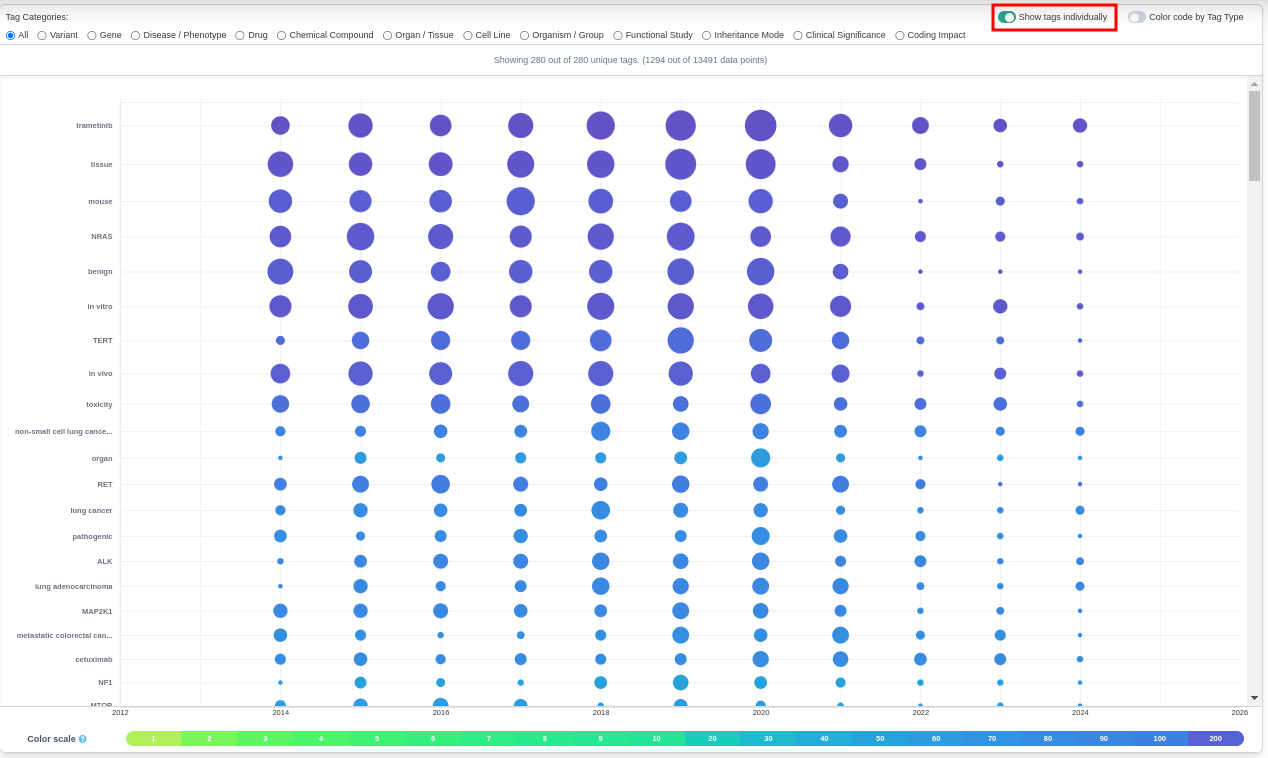
Hovering over a bubble tells you how many publications are linked
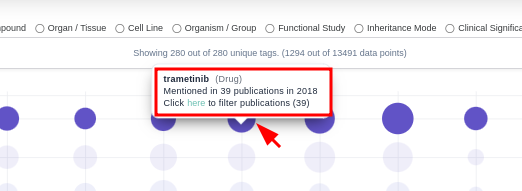
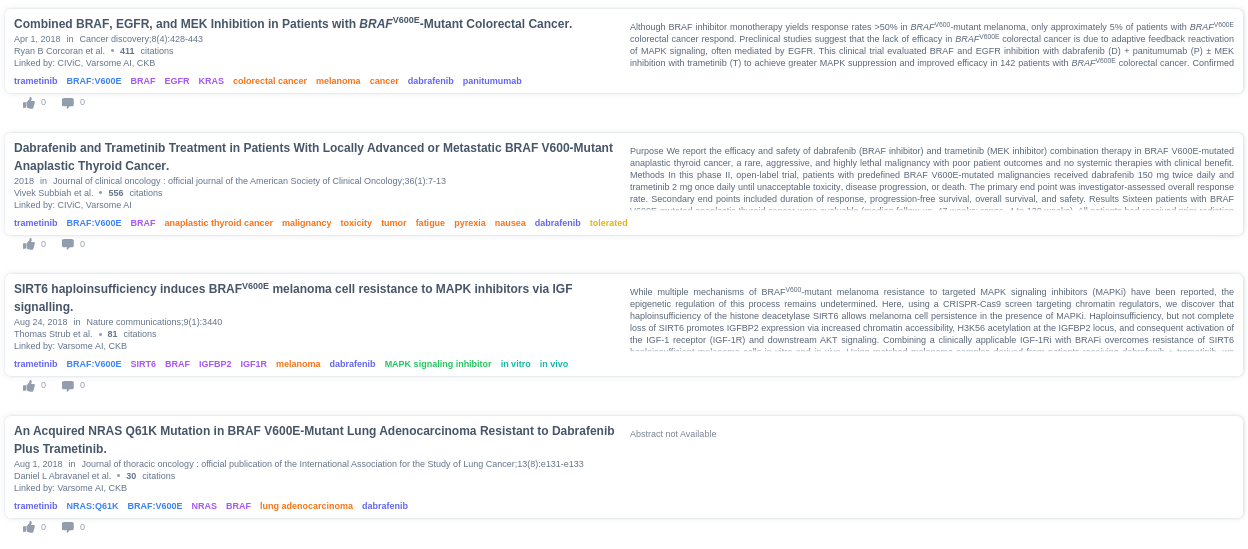
Clicking on here will display the list of the associated publications
You can also use the “Color code by Tag Type” in the following way:
In the initial setting the “bubbles” reflect the same color as the tags in the publications component. For example a green Disease tag in a publication will be represented by a green disease “bubble” and it is clear which disease is mentioned most often.

You can also switch to using a color scale. In this case the color of the “bubbles” represents a scale of the number of publications that mention a tag overall and is depicted at the bottom of the screen.
![]()
The size of the “bubbles” represents the number of publications mentioning a certain tag per year. So the larger the bubble the more publications there are in a given year mentioning the specific tag.
This enables you to see at a glance the years where there were more or less publications tagged with specific diseases. For example lung cancer was tagged less in 2022.

Additionally, instead of the "All" option you can select to show only the timeline of publications with diseases co-occurring with the variant of interest or its related gene.
For example:
All

Disease / Phenotype

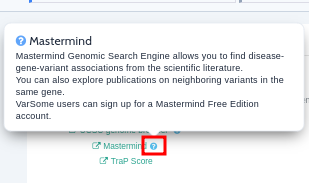
Mastermind Genomic Search Engine
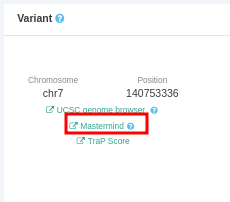
From the "General Information" tab:
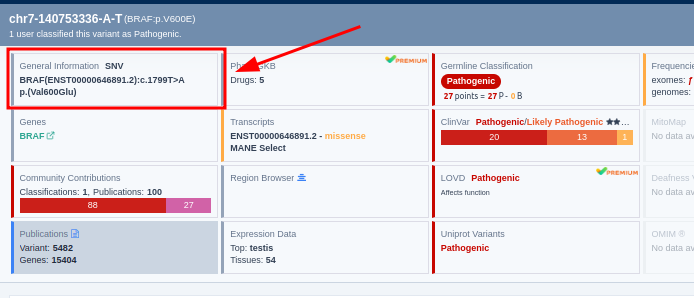
you can access the Mastermind Genomic Search Engine, which allows you to find disease-gene-variant associations from the scientific literature. You can also explore publications on neighboring variants in the same gene. VarSome users can sign up for a Mastermind Free Edition account.
Link Publications
You can also link publications to variants. For more information look the document "How can I link a publication to a variant?".
VarSome Clinical
In VarSome Clinical we show publications from PubMed related to the selected variant and its related gene in the "Publications" tab under the variant table results:
