In both pages you can learn about the analysis status (e.g. running). An email will be sent to you once the analysis finishes.
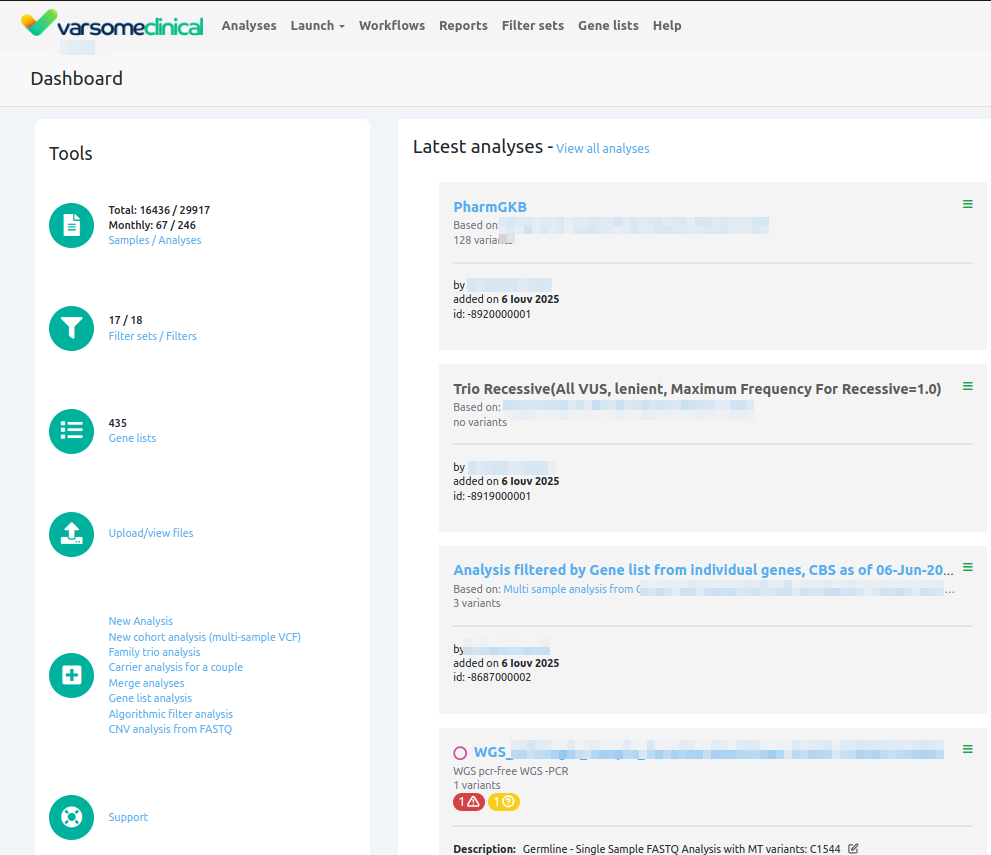
⚠️ Please note that when an analysis has no results to report, will be displayed in the sample's grey box and no active link will be visible to access the results.
If however an analysis doesn't report any information on the variants called (or not), it doesn't necessarily mean that it has no results to show.
When clicking on “Analyses”, you will be redirected to the Analysis Table View, a table that contains all the samples that you or members of your group have uploaded to VarSome Clinical. From the Analyses Table, you can see the status of each analysis you are running or have run as well as access the main analysis information and select any actions on an analysis.

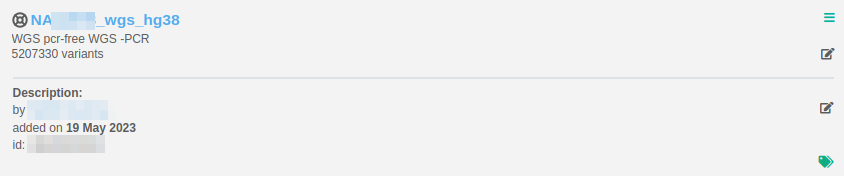
For each analysis, you can view some basic information like the name and the description of the analysis, the state, the phenotypes linked to this analysis (if any), the type of the sample (germline [G] or somatic [S]), the reference genome used for this analysis, the date it ran, the number of variants that were called, the number of tags added to this sample, the analysis ID, the name of the user that launched the analysis as well as the Assay used for this analysis.
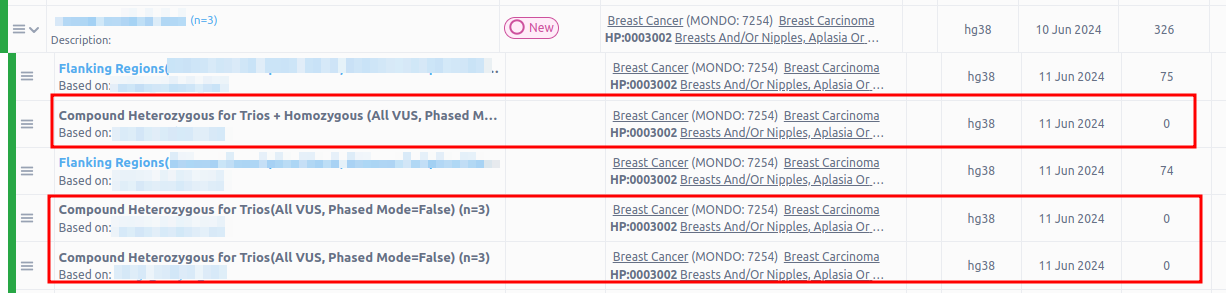
⚠️ If the number of variants in your main analysis or sub-analysis is 0, you will not be able to click on the analysis and open it as there would be nothing to display.
VarSome Clinical allows the user to search for any of the analyses in which a variant has been found. This can be done from the “Analyses” page, if you type the variant you are looking for and press enter/click on search (🔍):

Only those samples containing the variant will be shown in the "Analyses" menu.
In addition, it is also possible to identify samples containing the given variant within a subset of analyzed samples. To do this, you can combine the previous feature with the Sample Tags feature.
First, you will need to label the samples of interest using the Sample Tags. Then, you can go to the “Analyses” menu and search for a specific variant in a subset of samples labeled with a particular Tag.
In the example shown in the picture below, only those samples labeled with an "az" tag and containing the specific variant will be shown.

The accepted formats for variant search queries are the following:
- Chromosome - position - ref seq - variant seq (e.g. chr7:140453136:A:T)
- HGVS DNA-level variants (e.g. BRAF:c.1799T>A, BRAF(NM_004333.6):c.1799T>A)
- HGVS single amino acid substitutions (e.g. BRAF Val600Glu, BRAF p.Val600Glu, BRAF V600E)
- dbSNP rs id (e.g. rs113488022)
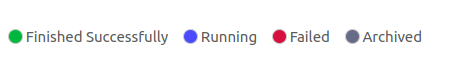
You can view the current status of each of your analyses from the colored bar on the left and by hovering the mouse over the bar:
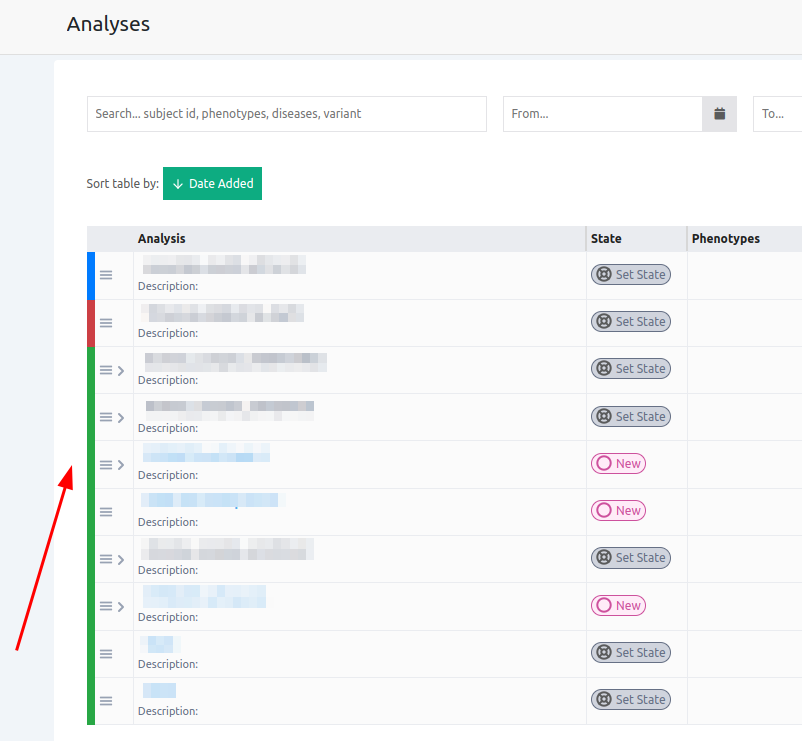
The different colors indicate different sample/analysis status that follow this pattern:
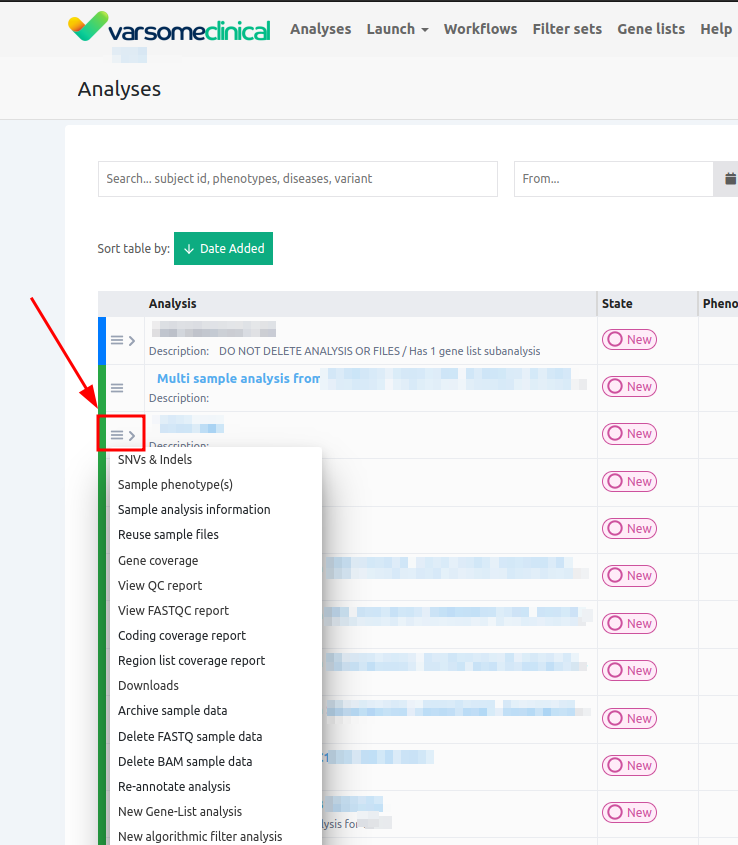
You can open the Analysis Actions menu by clicking on the three horizontal lines next to the name of the analysis:
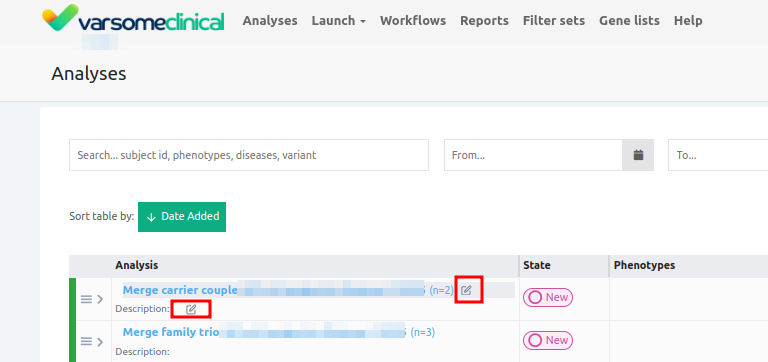
From the Analyses Table, you can also change the name or the description of your analyzed samples:
Additionally, when adding phenotypes to the analysis these will be displayed in the "Phenotypes" column.

When you launch any sub-analysis on your main analysis, you can click on the arrow on the left of the analysis to view the sub-analysis:


The Analyses Table view also displays possible issues detected in the sample by FastQC or other quality control measures applied:

Clicking on the error or warning icon will let you investigate the issue.

When an analysis is finished, it will appear on your Dashboard and, depending on the state of your clinical sample, you can select a predetermined status for it. The Clinical Sample Status is a way to organize analyzed samples within a team or between different teams that collaborate to yield a clinical result. In this way, when the analysis is finished and is ready for a curator team to examine the results and yield a diagnosis, the Clinical Sample Status can give information on the status of the analysis at a given moment by the previous team that worked on it. If a clinical diagnosis was completed for an analysis, the Clinical Sample Status can be changed to indicate whether a diagnosis was made or if no diagnosis could be reached
.
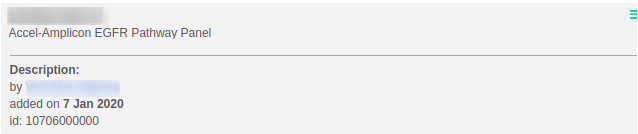
For the analyses that were performed before 11.7.5 release a black status icon will appear next to the analysis name and by clicking on it, you can select a status for your older analyses:
After an analysis is finished, you can choose between four different statuses:

: The analysis has finished running and its results can be viewed.
: The analysis is ready for review. This option is useful when multiple teams share the work of analyzing a sample, and the first team sets up basic filtering and then passes it on to the next team. Setting the state to "Ready" indicates that the first pass has been done and the sample is now ready to be viewed by the next team.
: A diagnosis has been made.
: The analysis was inconclusive: no diagnosis can be made at this time.
The Analyses tab displays all the analysed samples. You can use the Search field to look for sample names, users, phenotypes or diseases. Gene list analyses or algorithmic filters are displayed as sub-analyses of the main sample.

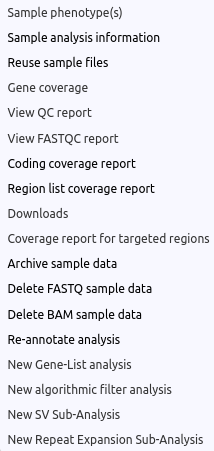
To see the list of available options for the analysis, click on ![]() :
:
|
Analysis starting from FASTQ: |
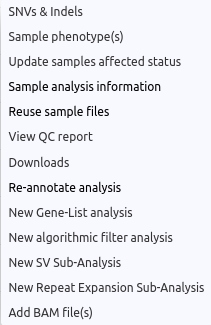
Multi sample analysis: |
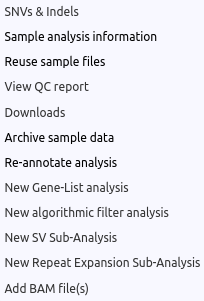
Analysis starting from VCF: |
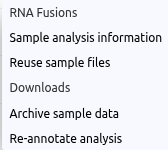
Fusion analysis: |
|
|
|
|
|